May 28, 2014
Changes in v1.1 for SP 2010 / 13 and v1.2 for SP 2007:
Fixed a bug where the list guid was not wrapped using curly braces. This made Microsoft Word fail to load the document information panel when you had a cross site lookup column in that library. To fix this, relink the lookup column again using the updated version.
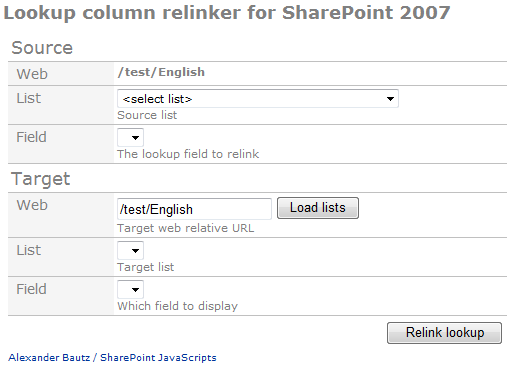
The difference between the 2007 and the 2010 version is that in 2007, you must place the code in a web part in the site where the lookup column resides.
You can target another site, but must run the code in the site where the column you want to alter is located.
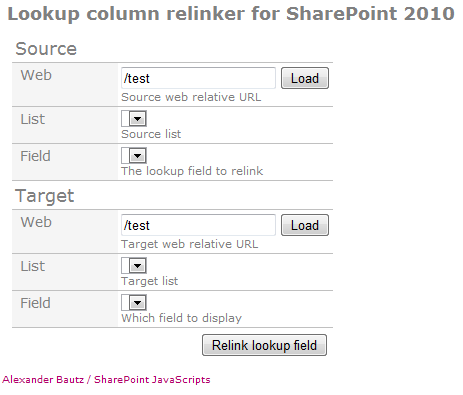
In the 2010 version, you can change the source web as long as you target a web within the site collection.
If you like the solution, buy me a beer using the Beer button on the top right of this page.
Changed the method for caching the filter values when loading the charts and changing the filter dropdowns. This should fix any errors when you have multiple filtered charts in one page.
Added option to override “chart options” set in the GUI by adding an object to the CEWP like this:
var chartOptionOverride = {"MyChart1":{"title":"This is the chart title!"}};
Changed the way the chart and the accessories are rendered to keep all items within the “chart container”. This helps in positioning the charts in the page.
Added option to load the chart manually.
Added option to display a placeholder / overlay when the chart is loading. This will prevent the page from looking like it has frozen while loading a heavy chart. The page is still unresponsive – but at least it looks better.
1.
What happens under the hood is that the chart is created in a separate container – dynamically created within the container defined in the CEWP. For those interested, this container is named containerId_chart. Where “containerId” is the id defined in the array “arrOfChartContainers” in the CEWP.
2.
You can delay the loading of the chart by 4000ms (4 seconds) like this:
<div id="MyChart1"></div>
<script type="text/javascript">
/*****************************************************
		Address all containers
*****************************************************/
// All charts must be represented by a container with a unique id.
// This container  must be present in the page
var arrOfChartContainers = ["MyChart1"];
var loadRC = false;
var allowEval = false;

var loadManually = true;
function manualLoad(){
	loadManually = false;
	spjs_GenerateChart();
}

setTimeout(function(){
	manualLoad();
},4000);

</script>
<script type="text/javascript" src="https://ajax.googleapis.com/ajax/libs/jquery/1.7.2/jquery.min.js"></script>
<script type="text/javascript" src="https://www.google.com/jsapi"></script>
<script type="text/javascript" src="/test/English/Charts/Javascript/3.3/SPJS_ChartsForSharePoint_v3.3.5.js"></script>
Or you can make a button and call the chart manually like this:
<input type="button" onclick="manualLoad()" value="Load chart">
<div id="MyChart1"></div>
<script type="text/javascript">
/*****************************************************
		Address all containers
*****************************************************/
// All charts must be represented by a container with a unique id.
// This container  must be present in the page
var arrOfChartContainers = ["MyChart1"];
var loadRC = false;
var allowEval = false;

var loadManually = true;
function manualLoad(){
	loadManually = false;
	spjs_GenerateChart();
}
</script>
<script type="text/javascript" src="https://ajax.googleapis.com/ajax/libs/jquery/1.7.2/jquery.min.js"></script>
<script type="text/javascript" src="https://www.google.com/jsapi"></script>
<script type="text/javascript" src="/test/English/Charts/Javascript/3.3/SPJS_ChartsForSharePoint_v3.3.5.js"></script>
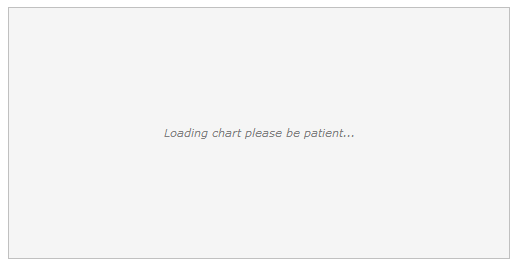
3.
To have a placeholder like this while the chart loads:
You must add this code to your CEWP:
<style type="text/css">
.chartLoadingOverlay{
	font-style:italic;
	color:gray;
	border:1px silver solid;
	background-color:#F5F5F5;
	line-height:250px;
	height:250px;
	width:500px;
	text-align:center;
	margin:2px;
}
</style>

<div id="MyChart1"></div>
<script type="text/javascript">
/*****************************************************
		Address all containers
*****************************************************/
// All charts must be represented by a container with a unique id.
// This container  must be present in the page
var arrOfChartContainers = ["MyChart1"];
var loadRC = false;
var allowEval = false;

var loadManually = true;
function manualLoad(){
	loadManually = false;
	spjs_GenerateChart();
}
</script>
<script type="text/javascript" src="https://ajax.googleapis.com/ajax/libs/jquery/1.7.2/jquery.min.js"></script>
<script type="text/javascript" src="https://www.google.com/jsapi"></script>
<script type="text/javascript" src="/test/English/Charts/Javascript/3.3/SPJS_ChartsForSharePoint_v3.3.5.js"></script>
<script type="text/javascript">

$.each(arrOfChartContainers,function(i,id){
	$("#"+id).html("<div class='chartLoadingOverlay'>Loading chart please be patient...</div>");
});
setTimeout(function(){
	manualLoad();
},100);
</script>
The setTimeout is necessary to let the browser render the overlay before it freezes while retrieving the data for the chart.
Please note the these features require v3.3.5 of SPJS Charts for SharePoint.
Change the script src to use a local copy of jQuery if you prefer that.
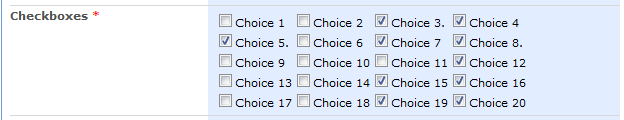
You call the function with an array of the FieldInternalNames you want top apply this solution to, and the number of columns to distribute the choices over like this:
January 13, 2013 Updated to v2.65 with these changes:
Fixes:
Validation text was shown multiple times if the rule was triggered repeatedly.
When saving the GUI the input values for visible or hidden tabs / headings got the previous rule value if the fields were left blank.
Error message in DispForm due to “customValidationMsg” being triggered.
Update the css file (note the text “Dynamic Forms for SharePoint v2.65” in the top) to help wrap the tabs better when not using the “Break tabs at index” option.
New features
It’s now possible to have a rule check other rules before triggering.
January 4, 2013 Updated to v2.61 BETA with these changes:
Set field value had a bug preventing choice fields from being set correctly.
Added MUI support for the validation message / alert.
January 1, 2013 Updated to v2.6 BETA with these new features:
Option to bypass all rules for selected users or groups (Misc tab).
Set date column value like [today], [today]-14 or [today]+14.
Tabs now support MUI.
Added support for headings (MUI).
Changed boolean column behavior to fix issue with hiding tabs.
You must update these files: “DynamicFormsForSharePoint.js” and “default.css”.
Regarding setting a date column to [today]
Not all reginal settings are supported. You will get an alert with instructions if your LCID is not supported.
Headings
You find the headings in the tabs section, and you add them as you do with the fields. Hover over the help icon in the GUI to learn how to set up MUI
The form was hidden when no settings were found (first setup) – thus hiding the link to initiate the setup. It was still possible to use ?dfsetup=1 to initialte the setup.
Whan not using TABS in SP2007, you go a javascript error:
“The value of the property ‘ExecuteOrDelayUntilScriptLoaded’ is null or undefined, not a Function object”
01.11.2012 Updated to v2.5 with these changes:
Finally, you can rearrange the order of RTE fields in the tabs.
Initial form visibility set to hidden to prevent flashing all fields before applying rules / tabs (display:none is not used because the dialog size would be distorted).
NOTE: You must update both “DynamicFormsForSharePoint_v2.js” and “default.css”.
19.10.2012 Updated to v2.41 with these changes:
The action “Set field value” can now pull values from other columns in the current form (in addition to item ID) – as requested by Morten. To include a value from another field, enter the FieldInternalName like this: {Title}.
Added trigger “The form is saved”. This trigger will affect the action “Set field value” only.
Added password obfuscation as requested by Matthias.
15.10.2012 Updated to v2.4 with these changes:
Minimum dialog width (SP2010) set to 700px in default.css.
The variable “_spUserId” is changed to “_spPageContextInfo.userId” in SP2010 as some users are missing the “_spUserId” variable in their master page.
The edit link was previously only visible for the person who first set up the solution. It is now visible for all users. Protect the settings with the built in password functionality.
Added a fix to handle multiple single item lookup columns with more than 20 items in different tabs (in IE). The problem was that the options “dropdown” sometimes did not render.
To fix the problem when adding more than 2 rich text or enhanced rich text columns (in SP2007 only) broke the script, I have disabled the ordering of those field types completely. Put them in the top or bottom of the form (using list settings).
Added “Is in group trigger”.
Added single choice lookup columns as trigger.
Added show or hide tabs by rule option.
The changes are in the files “DynamicFormsForSharePoint_v2.js” and “default.css”.
18.08.2012 in v2.3:
Added option to show a tab only for members in selected SharePoint groups.
Fixed a bug in date columns when you type in the value, in combination with the “alert validation message option”.
15.08.2012 in v2.2:
Added option to alert the validation message.
Added support for “All fields tab” – to enable, add a tab with no fields.
Enabled solid color table background – same color as the selected tab. To disable, remove line 51-63 in the default.css file.
14.08.2012 In v2.1: Changed the “Orphan fields” handling by adding a checkbox “Show orphan fields in a separate tab” in the tabs configuration, ensured compatibility with Christophe’s Easy Tabs and changed the tab position in non-dialog forms in SP2010.
Integrated with the Tabs for SharePoint forms solution. You can now rearrange the order of the fields in the tabs (not true for rich text fields).
Added option to hide save item button based on a rule.
Added option to apply a rule if the current user is not the author of the item.
Added option to set a field value based on a rule.
Added support for handling the content type selector (hide, read only, set value).
Added option to hide the attachments, or set them as read only (hide the “delete link”).
Added option to show a validation message when applying a rule.
Setting a field as read only now shows the field description as well.
Some bugfixes
The solution is still compatible with both SharePoint 2007 and 2010.
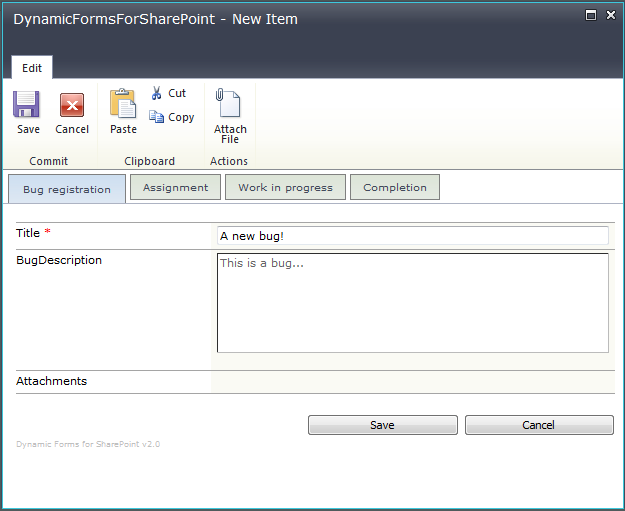
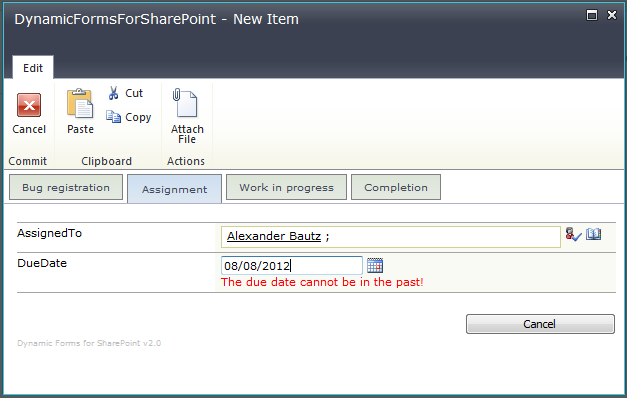
Some screenshots
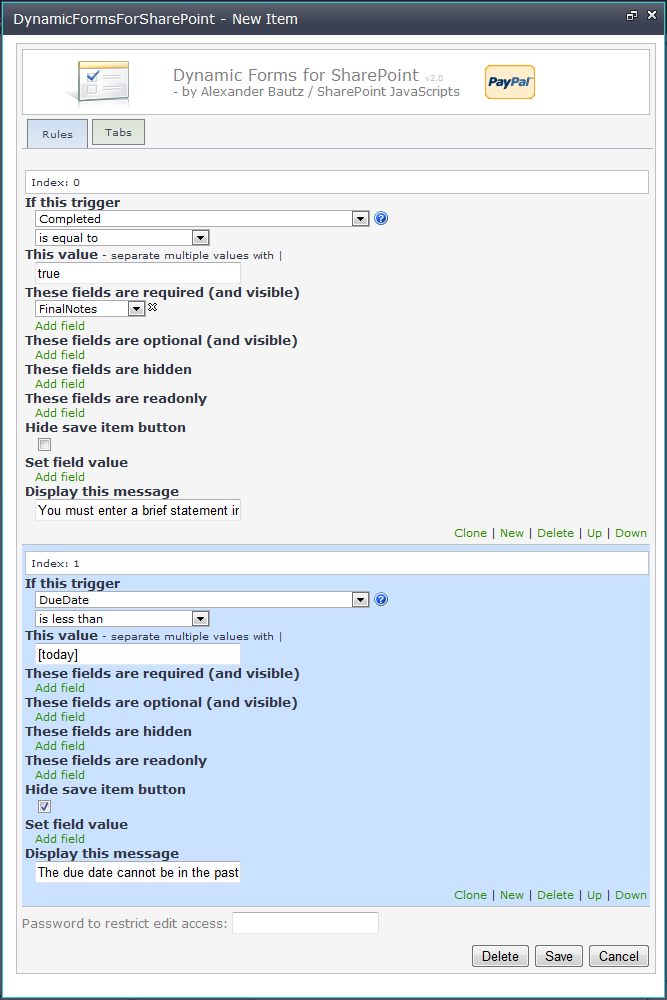
Rule configuration
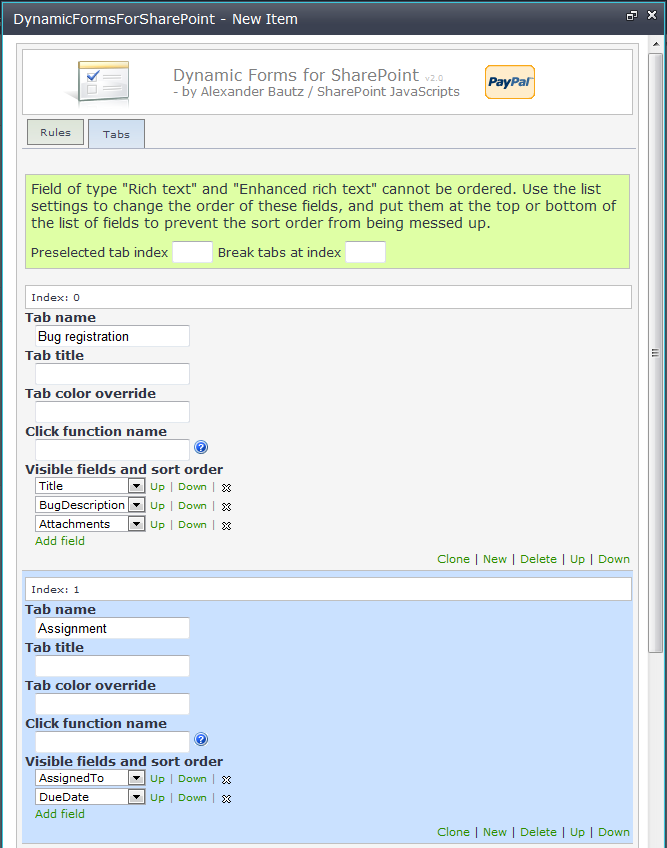
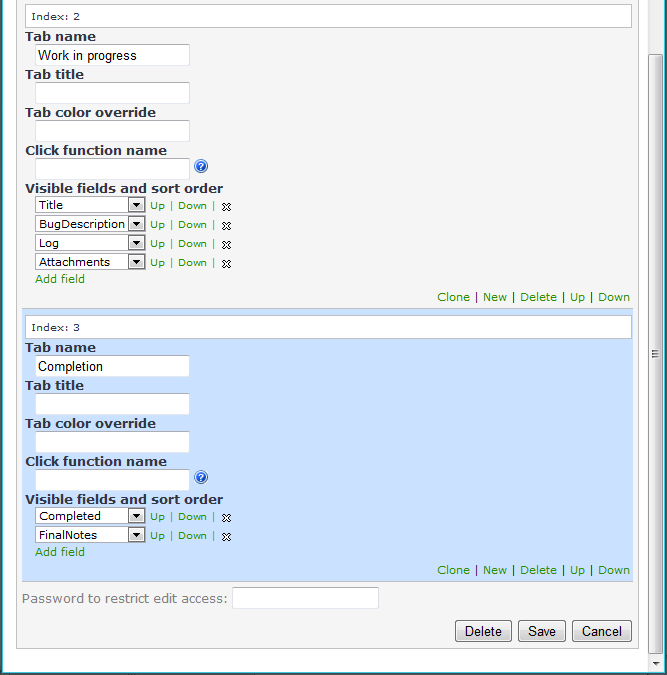
Tab configuration
DueDate rule I have entered a date in the past to demonstrate the validation. Note that the save item button has disappeared.
Complete task rule
When clicking the “Completed” checkbox, the “FinalNotes” field is set as required, and the label “You must enter a brief statement in the field below.” is shown.
Tabs or Rules – or both
You can decide whether you want to use both features, or just one of them. Simply delete the last rule or tab configuration to disable that module.
There are one change to the CEWP code as you now have to refer a css-file. You also have to add an image to the same folder as the css file. This is used to add a gradient color to the tabs.
Added more options to process the values pulled back from the query. In addition to the previous substring, you can now have prefix and suffix and additional date formatting options. Hover over the help icon to learn more. Please note that you must reconfigure any existing “substring setup” after upgrading to v1.3.
Added support for hyperlink columns.
Added count to the “Action menu”.
Fixed bug with “hide field” when using a text string enclosed in curly braces in the “In URL” configuration.
25.01.2013 Updated to v1.26 Added option to split the string by a specified separator, returning a selected array index.
30.11.2012 I have updated to v1.23 to fix a compatibility issue with Office 365 for SP2013.
18.11.2012 Updated to v1.22 and added some video tutorials:
Please note that this requires v1.22 of vLookup_sp2010.js
08.11.2012 v1.2 fixes some bugs and adds some new features.
Bugs fixed:
Removed an extra “/NewForm.aspx” from the url generated in the “addChild” function.
When creating a child in a subsite or a parent site, the setting of values from the “parent item” failed due to a wrong baseUrl parameter in the URL.
Features added:
As suggested by “advacomp”, added an option to use a text string to set a field in the child list. See instructions on the help icon in the “In URL” section of the setup.
Added an option in the GUI to hide the form label in DispForm and EditForm.
16.10.2012 v1.1 fixes a bug with wrong list ID appearing when you edit the configuration from DispForm or EditForm.
I have previously posted a solution for SharePoint 2007, and by request I have rewritten the solution for SharePoint 2010. Please note that this solution will NOT work for any SharePoint version prior to SharePoint 2010.
This solution, as the previous one, supports these “methods”:
Show all records: Returns a list view of all the records.
Sum: Sums the values for all the records.
Average: Sums the values for all the records, and devides the sum on the number of non-empty records.
In the 2007 version, the configuration was setup in a calculated column trough the list settings > edit field.
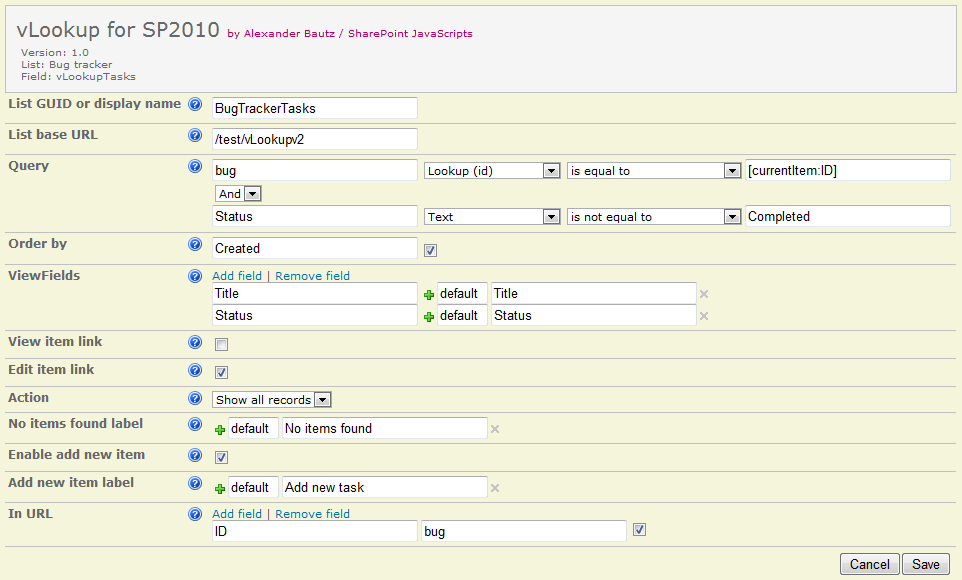
This new solution is much easier to set up as it has a GUI:
In this solution, the configuration is stored in a dedicated list – shared by all vLookup columns in the site. This eliminates the fiddly work of hand editing the configuration.
When you first setup this solution in a site, the configuration list is created automatically. This list is not to be hand edited, and you might optionally hide it from browsers trough SharePoint Designer. You must however ensure all users have read access to this list.
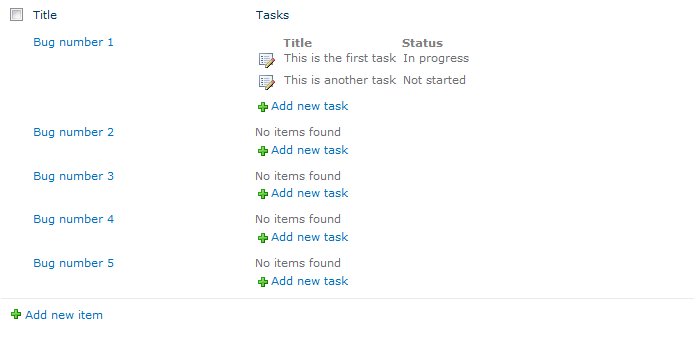
You can use this solution in plain list views, grouped views and in DispForm / EditForm (see note bout field type below).
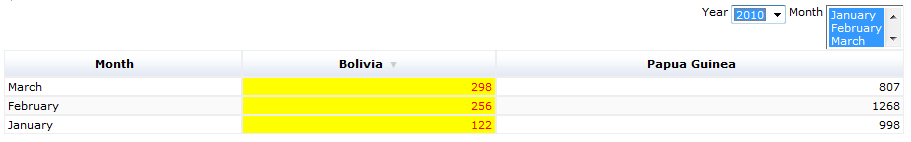
When this solution is setup in a list view, it looks like this:
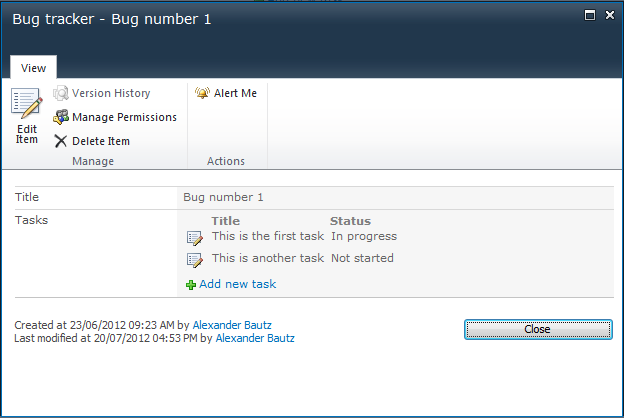
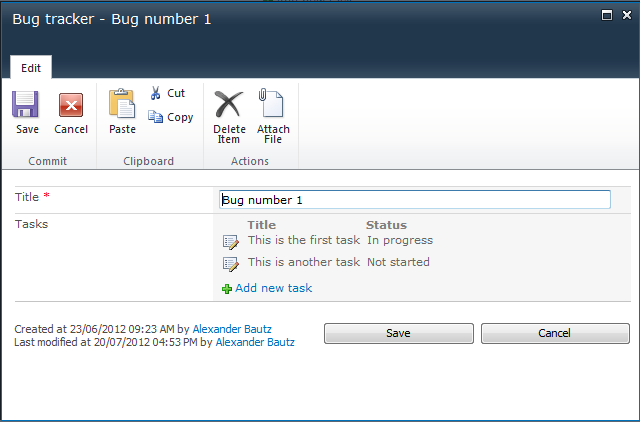
DispForm and EditForm:
Adding new “Tasks” in EditForm does not refresh the form, only the “vLookup items” – thus you does not lose unsaved data in your EditForm.
How to set up the solution
Download the code for the file “vLookup_sp2010.js” from here.
Download the file “spjs-utility.js” from here. Ensure you get the latest version (by date of the folder).
If you prefer a local copy of jQuery, get it here.
Upload this files to a library in your SharePoint site collection, or to a folder in the root site – created using SharePoint Designer.
Add a column to your list / library where the FieldInternalName starts with “vLookup”. This is what triggers the solution. Note that it’s the FieldInternalName and not the Display name that must match.
You can use both a calculated column or a single line of text column as “placeholder” for the “vLookup items”. If you use a calculated column, use a formula like this:
=""
The contents of the field will be overwritten anyway.
To be able to have the solution work in EditForm, you must use a single line of text column as “vLookup field”. Note that you cannot use this field to store anything as the contents will be overwritten by the vLookup solution.
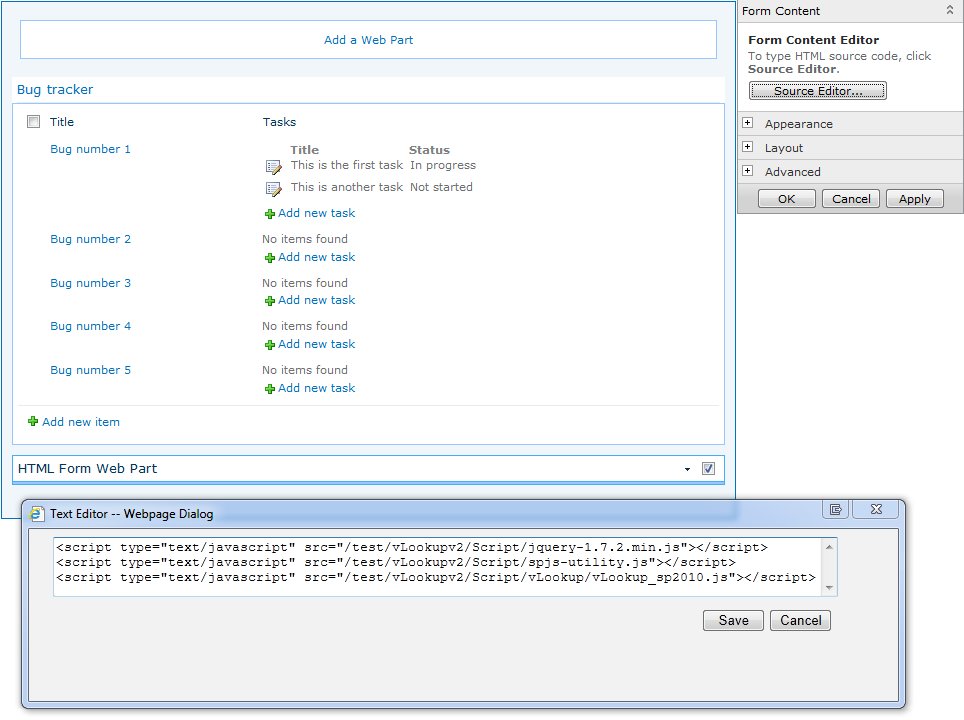
Add a HTML Form Web Part to the bottom of your list view, DispForm or EditForm, and add this code trough the “Source editor”:
You use the exact same code for list views and for list forms.
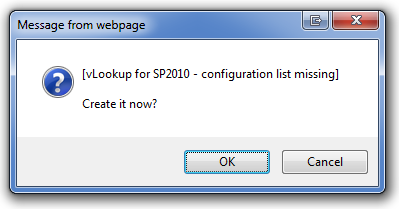
Creating the configuration list
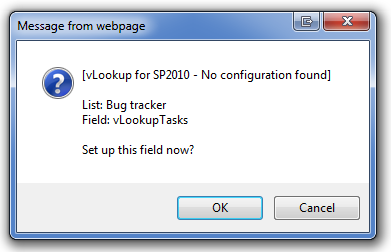
The first time you set up the solution, you will get this prompt:
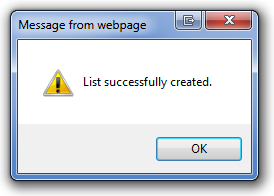
Hit “OK” to create the list:
You will now get this prompt (provided your field is in the view):
You will now be presented with the configuration GUI:
This GUI is automatically presented while the configuration has not been created, or it contains errors that are detected by this solution. To reenter the configuration at a later time, add “vLookupSetup=1” to the URL like this:
// List view
.../Lists/MyList/AllItems.aspx?vLookupSetup=1
// DispForm
.../Lists/MyList/DispForm.aspx?ID=12&vLookupSetup=1
All the configuration option are explained by hovering over the question mark.
Creating new items in the “child list”
When you add items to the child list, and want to prefill values in your NewForm, you use the In URL section of the configuration to set the “from” and “to” fields.
You must add the same code to a HTML form web part below the form web part in NewForm as you have used in DispForm and list views. This code will pull in the values from the “parent list” and fill in the “child list”.
If you are “connecting” the two lists by a lookup column, ensure you prefill the lookup column like in the example in the top of this article.
MUI support
This solution supports MUI and you can set labels and column headers in multiple languages. Use “default” as “LCID” to have a default value and/or set up the correct LCID (matching your installed language packs) as alternate values.
Do you use this solution?
I spend a lot of time developing these free solutions. If you use it, please hit the PayPal button to send me a few bucks as motivation for releasing new solutions.
When setting up a chart filter, you now have an option “multiselect” which you can set to true to have multiple selection in the filter select. You can also specify the size of the select. See the “Instructions” link above the filter setup textarea.
2. Added formatter: ColorFormat
Description pulled from here
Assigns colors to the foreground or background of a numeric cell, depending on the cell value. This formatter is an unusual, in that it doesn’t take its options in the constructor. Instead, you should call addRange() or addGradientRange() as many times as you want, to add color ranges, before calling format(). Colors can be specified in any acceptable HTML format, for example “black”, “#000000”, or “#000”.
3. Added DataTable Roles (Experimental)
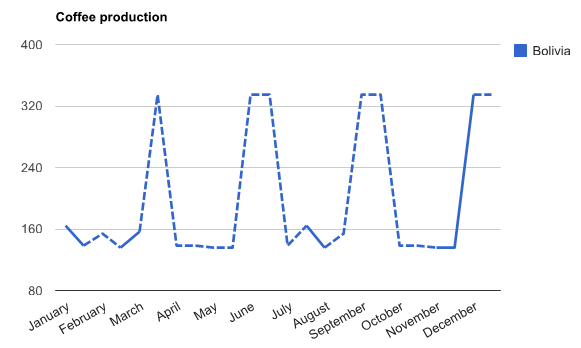
Dotted line represents uncertain numbers.
Description pulled from here
Google DataTable and DataView objects now support explicitly assigned column roles. A column role describes the purpose of the data in that column: for example, a column might hold data describing tooltip text, data point annotations, or uncertainty indicators.
Previously, there were only two roles available to a column: ‘domain’ which specifies major axis labels; and ‘data’ which specifies bar heights, pie slice widths, and so on. These roles were assigned implicitly, based on the order and type of the columns in the table. However, with the ability to explicitly assign column roles, you can now add optional columns that provide new, interesting features to a chart such as arbitrary annotation labels, hovertext, and uncertainty bars.
4. Filter multiple charts with the same filter controls
You can apply the same filter on multiple charts in a page. To do this, add the parameter “filterAdditionalCharts” to the filter setup textarea like this:
You supply an array of additional chart container IDs to apply this filter to. If you set up multiple filters, you only have to set this parameter for the first filter select. In the additional charts, you must set up the Custom CAML to consume the filter values.
5. boolean configuration options will now be handled properly
Previously there were a problem using boolean options like “sortAscending”. This has now been fixed.
6. Alphabetically sorted field names in field select – now with FieldInternalName in parentheses
In the “Edit Chart GUI” the field names are now Alphabetically sorted. You also have the FieldInternalName in parentheses behind the display name. This might come in handy when setting up custom CAML.
7. Load the Google Visualization API release candidate
Google periodically releases a new version of the Google Visualization API. As the API does not have support for versioning, the new version is forced on everyone using this tool. To stay one step ahead, you might want to check out the release candidate before it goes live. To do this, you can set the variable “loadRC” to true in the CEWP code (as before), or you can now use a query string parameter in the URL like this: