10.12.12 I introduced a new bug in v3.3.7 that broke the filter if you did NOT use “filterAdditionalCharts”. This should be fixed in v3.3.8.
13.11.2012 Updated to v3.3.7 to fix a bug regarding “filterAdditionalCharts” in the Custom CAML filter setup. This was broken in v3.3.6 – thanks to Paul Brown for notifying me.
Please note that you now have to supply the parameter for each filter in the filter setup. Click the “Instructions” link above the filter setup textarea for details.
20.09.2012 Updated to v3.3.5
06.09.2012 Updated to v3.3.1. This update is an attempt to fix an issue where you apply multiple formatters on the same column, and only the last one sticks.
18.07.2012: Updated to v3.3 and added a few new features. See this article for details.
07.06.2012: Updated to v3.2.2 to add support for special characters like single quote and “&” in the filter options. See change log.
29.05.2012: Updated to v3.2.1 to fix a bug. See change log.
31.03.2012: Updated to v3.2.
Added filter wildcard to allow “Show all” when using dropdown filter. See “Filter setup Instructions” in the “Edit chart GUI”.
See change log for details on some small bugfixes.
21.02.2012: Updated to v3.1.5. See change log.
14.02.2012: Updated to v3.1.4. See change log.
13.02.2012: Updated to v3.1.3. See change log.
06.02.2012: Updated to v3.1.2. See change log.
06.02.2012: Updated to v3.1.1 to avoid using eval. Read more in the article. Thanks to Christophe for pointing me to the “jQuery.parseJSON()” method – I was not aware that jQuery had this built in.
Keywords: New chart types, multiple dropdown filters and variables in the custom CAML query.
I have “silently” released version 3 of the “Charting for SharePoint using Google Visualization API” solution in November 2011. You find it here. The 3.0 release was not so mush about new functionality, but focused more on tidying up the GUI to make it easier for the user to understand the configuration options.
In the work with v3.0 i realized that i did not have any distinct name for the solution, and I decided to name the solution SPJS Charts for SharePoint.
| A full walktrough of the configuration options in v3.0 can be found in this book from O’Reilly. The book is a collection of articles from Nothing But SharePoint. The article you find in this book (Publication Date: February 24, 2012) has not been published elsewhere. |
 |
To start using this solution, you only need the rights to create a list (will be done automatically by this solution), upload files and add a CEWP or a HTML form web part to a page.
After the initial setup, all you need is contribute rights to edit charts.
The setup process contains four steps:
- Download the file “SPJS_ChartsForSharepoint_v3.x.js” and “CEWP.txt” from here from here. You can choose between the uncompressed (124KB) “SPJS_ChartsForSharePoint_v3.1.js” and the packed, smaller version version (64KB) “SPJS_ChartsForSharePoint_v3.1_min.js”. The latter is packed using packer. You find the CEWP code and the script file in separate folders. The folder name will reflect the script version. Ensure you download the latest version, and that you read the change log.
- Upload the file “SPJS_ChartsForSharepoint_v3.x.js” to a document library, or put it in a folder created with SharePoint Designer for safer storage. Ensure all users have read access to the file.
- Copy the link to the file “SPJS_ChartsForSharepoint_v3.x.js” and replace the example path in the CEWP code so that it reflects your local copy.
- Either upload the CEWP code to the same folder as the file “SPJS_ChartsForSharepoint_v3.x.js” and use the content link option in a CEWP to link to the code, or use a HTML form web part and insert the code directly in the “Source editor”.
Reload the page, and if it is the first time it is run in the site, the solution will prompt you to create the configuration list. If you are upgrading from an earlier solution, you are prompted to update the configuration list. Both actions require no more than a click on the OK button to complete.
Ensure you have selected the “native” language for the site collection before you complete the update of the configuration list. If you fail to do so, the update will not take effect and the prompt will not go away.
Switched GeoMap for GeoChart and added BubbleChart and SteppedAreaChart.
In the previous versions, you could create ONE dropdown filter above the chart. In v3.1 you can have multiple. The setup of the filter have changed, and those updating from a previous version will have to redo the filter setup (you will get an error message telling you that the filter setup is wrong).
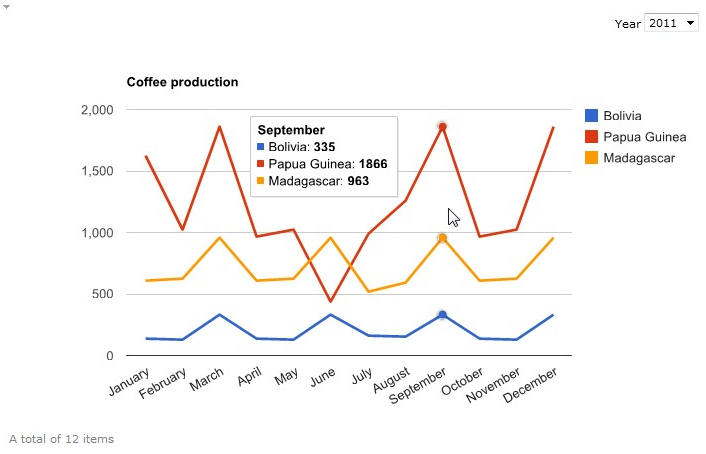
The chart example above has this filter setup to create the “Year dropdown”:
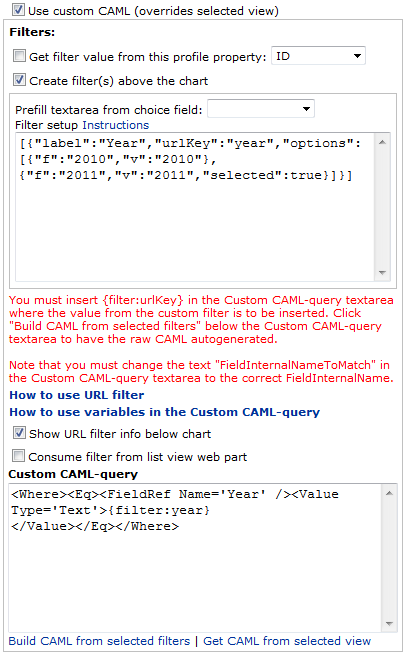
You can have multiple filters created in the same way, Click “Instructions” above the Filter setup textarea to expand this description:
[{“label”:”Year”,”urlKey”:”year”,”options”:[{“f”:”2011″,”v”:”2011″},{“f”:”2012″,”v”:”2012″,”selected”:true}]},{“label”:”Status”,”urlKey”:”status”,”options”:[{“f”:”Not started”,”v”:”0″},{“f”:”In progress”,”v”:”1″,”selected”:true}]}]
The object properties:
label: The label in front of the dropdown.
urlKey: The parameter in the url that identifies the value.
f: Friendly name for the option. Can be the same as “v”.
v: Internal name for the option. Can be the same as “f”.
selected: true if the option should be preselected.
When you have written or prefilled the filter (by selecting it from the “Prefill textarea from choice field-dropdown”), you must add the appropriate CAML in the “Custom CAML-query” textarea. You can start by clicking “Build CAML from selected filters” below the Custom CAML-query textarea to have the raw CAML autogenerated.
Note that you must change the text “FieldInternalNameToMatch” in the Custom CAML-query textarea to the correct FieldInternalName.
The new filter method can use eval1, and thus you can have parts of, or even the complete filter as a variable in the CEWP. To do this, you create a variable in the CEWP code and inserts the variable name in the “Filter setup” textarea. Please note that the CAML is “static” and you must insert the corresponding {filter:urlKey} in the Custom CAML-query textarea to pick up the filters.
var allowEval = true;
Another new feature is the ability to use variables directly in the CAML. Construct the variables in the CEWP code like an object named “spjsCAMLvariables”, then insert {variable:variable_name} in the Custom CAML-query textarea where you want the variable to be inserted. “variable_name” represents one property from the object “spjsCAMLvariables”.
In the following example i have used it to filter a calendar to show this weeks items.
In the CEWP code you insert code like this to get the two variables “thisWeekMonday” and “thisWeekSunday”:
// Get todays date
var today = new Date();
// Find monday in current week
while(today.getDay()!==1){
	today.setDate(today.getDate()-1);
}
// Create two date objects - one for Monday and one for Sunday
var monday = new Date(today);
var sunday = new Date(today.setDate(today.getDate()+6));
// Convert the dates to ISO8601 format: yyyy-mm-dd for use in CAML
var thisWeekMonday = monday.getFullYear().toString()+"-"+(monday.getMonth()+1).toString()+"-"+monday.getDate().toString();
var thisWeekSunday = sunday.getFullYear().toString()+"-"+(sunday.getMonth()+1).toString()+"-"+sunday.getDate().toString();
// the object used in the Custom CAML-query
var spjsCAMLvariables = {"thisWeekMonday":thisWeekMonday,"thisWeekSunday":thisWeekSunday};
Insert the variables in the Custom CAML-query textarea like this:
<Where>
<And>
<Geq>
<FieldRef Name='StartDate' /><Value Type='DateTime'>{variable:thisWeekMonday}</Value>
</Geq>
<Leq>
<FieldRef Name='StartDate' /><Value Type='DateTime'>{variable:thisWeekSunday}</Value>
</Leq>
</And>
</Where>
Hit “Save” and your chart will always show the current weeks items.
var loadRC = true;
I have changed from “eval” to “jQuery.parseJSON” to handle the configuration options. The new method is a bit more picky on the syntax of the parameters and you must ensure to use double quotes and not single quotes for the option value.
Example:
Wrong syntax
colors:[‘red’,’#004411′]
Correct syntax
colors:[“red”,”#004411″]
If you use this solution, please consider buying me a beer!
Alexander
Instead of eval, you could (should?) use a library like json2.js . It is the library I use for backward compatibility.
I tested this library in the process, but I could not get it working as the built in JSON.
I’ll look at jQuery.parseJSON you referred below.
Alexander
Actually, as your solution is based on jQuery you could use the jQuery built in parseJSON http://api.jquery.com/jQuery.parseJSON/
Hi,
I was actually not aware that jQuery had this built in… Thank you!
I’ll look at it and see what I can do to get away from eval.
Alexander
I updated to 3.1.1 and JSON does not seem to like the Google API customization options.
FireFox Error:
Configuration Option error in “Team Chart”
Parameter: colors
SyntaxError: JSON.parse: unexpected character
——
Formatters used:
title:Team;vAxis.format:###%;vAxis.minValue:0;vAxis.maxValue:1;focusTarget:category;legend:none;colors:[‘tomato’,’#4682b4′];hAxis.slantedText:true
More information ..
Webpage error details
User Agent: Mozilla/4.0 (compatible; MSIE 8.0; Windows NT 5.1; Trident/4.0; .NET CLR 2.0.50727; .NET CLR 3.0.04506.648; .NET CLR 3.5.21022; InfoPath.2; .NET CLR 1.1.4322; .NET CLR 3.0.4506.2152; .NET CLR 3.5.30729; MS-RTC LM 8; .NET4.0C; .NET4.0E)
Timestamp: Mon, 6 Feb 2012 21:48:59 UTC
Message: ‘formatterArr[…]’ is null or not an object
Line: 2463
Char: 4
Code: 0
Change the single quotes for double and you should be good to go.
Alexander
It seems not to ignore the case. If there’s a SharePoint site collection url /sites/SiteAddress users sometimes write /sites/siteaddress or /sites/Siteaddress , which causes charts not to render.
Hi,
I’ll need a bit more details on web browser and possibly a few screenshots to understand the problem.
Alexander
The problem at least seems to occur when storing the charts in list view aspx pages.
For example, adding a chart in /sites/SiteName/Lists/ViewAddress.aspx generates a SPJS config list row /sites/SiteName/Lists/ViewAddress.aspx. Now when accessing the site with /sites/sitename/… the chart does not show up and modifying the chart changes the SPJS config entry to Lists/ViewAddress.aspx (omitting the /sites/SiteAddress/ from the beginning).
Hi, I see that your site is on a managed path, but i need some more information.
Are you using the latest version (3.1.2)?
Are you site collection administrator?
Which browser are you using?
Alexander
I am using the latest version (but the problem was present in the previous version I used 2.9.x also). The browser is IE9. I am the site collection administrator.
Safari, Chrome, FF do not fill the Select view dropdown in SPJS chart configuration.
Hi,
I guess the missing view issue has to do with a wrong setting in the “web” selector.
I did a fix for Firefox forgetting the “web” when editing a configuration in v3.1.2 Is it this one you have been using?
I have released v3.1.3 with a few bugfixes for a mistaken “prop” vs “attr” issue.
I have put back the “GeoMap”.
Please try it and let me know if it helps.
Alexander
GeoMap works as well as SPJS configuration with FF3.6+, Chrome, Safari, thanks.
However, the url issue still exists. Say I place the chart on the root default.aspx of the site collection. Now when I first access the site using /sites/SiteName/default.aspx I get to configure the chart and it works. But when I now access the site using the lowercase address /sites/sitename/default.aspx I see a default chart instead of the the configured one. I have to configure the chart again. But if I now access the previous address /sites/SiteName/default.aspx I see the old configurations: SPJS has created me two configuration entries in the SPJS Charts for SharePoint configuration list:
/default.aspx:MyChart1
and
/sites/SiteName/default.aspx:MyChart1
This issue should be fixed in v3.1.4. Please test it and report back.
Alexander
Setting the region parameter caused a JavaScript error ‘Object doesn’t support property or method ‘toLowerCase’.
I only checked the region parameter. The browser was IE9.
This error was there also earlier I guess.
Based on quick testing text values seem to work (‘world’) but numeric not.
I’ll look into it and fix this issue in the next release.
Alexander
I’ll need a screenshot to see how your configuration looks like – and the error message. I have tested using
Option: region
Value: 011
and it works as expected.
Alexander
Works when region code starts with 1. Throws an error if region code starts with zero.
For example, testing with region code 150:
Chrome:
Uncaught TypeError: Object 150 has no method ‘toLowerCase’
IE9:
Microsoft JScript runtime error: Object doesn’t support property or method ‘toLowerCase’
Note: in IE9 the debugger shows the following code as yellow throwing the error: var a=Pj(a[Mb]())
after the following code:… Km=em(“regioncoder”,Gc)+”geocodes”,Lm={};function Mm(a,b){var a=Pj(a[Mb]())
Firefox:
the error message is “a[Mb] is not a function.
Sorry it was just the opposite: Works when region code starts with zero, throws an error is starts with one.
Please send me some screenshots of your chart configuration (the GUI) as i cannot recreate this issue.
Alexander
This is fixed in v3.1.5.
Alexander
Thanks, works fine!
GeoMap seems not be available any more..?
We seem not get the highlight effect or nice looking fonts oob with the new GeoChart. Maybe this is because SharePoint uses some IE8 compatibility rendering?
Would it be possible to have the alternative to use the old (Flash based) GeoMap?
Works well with FF3.6-> and the latest Chrome and Safari, but unfortunately not with IE7-9.
GeoMap is back and works great – thanks!
Hello Alex,
im facing a problem with the new version:
The “colors” Option with the “value” [‘red’,’blue’] dont work anymore.
Parameters: colors
Syntax Error: unknown symbol
Any idea?
Replace single quotes with double quotes. Alexander
Worked, Thanks!
Hello Alex,
I am really scratching my head on this. I have everything working in terms of adding 3 CEWP’s and 3 charts. Each chart is setup with a distinct id and the ids are referenced in the script. However when the charts display, I get 3 instances of the “edit chart” at the top of each graph as well as 3 instances of the totals at the bottom of each chart. I can’t seem to figure out why…any thoughts?
Hi,
Look at the file “CEWP_multiple_charts_in_one_page.txt” here
It will give you 3 charts in one CEWP.
Alexander
Thanks that worked great! One final question for you. I am not a programmer so most of this is greek to me. 🙂 Is there some way in the interactive chart to have it link to a list view? In other words if I hover over October sales in the chart and it shows the totals, can I click there and open the list with that specific view?
Hi,
Add this example function to your CEWP code and tweak it to match your setup:
function chartSelectionHandler(data,chart,chartID){
	var selection, item, x, y, z;
	selection = chart.getSelection();
	if(selection.length>0){
		item = selection[0];
		if(item.row!==undefined){
			x = data.getFormattedValue(item.row, 0);
			if(item.column!==undefined){
				z =  data.getFormattedValue(item.row, item.column)
				y = data.getColumnLabel(item.column);
			}
		}
		if(x===undefined && y===undefined && z===undefined){
			return;
		}
		// Create your filter
		alert("These are the variables you can use for your filter:nnx = "+x+"ny = "+y+"nz = "+z);
		if(confirm("Open filtered list?")){
			if(chartID==='MyChart1'){
				window.open('/test/English/Charts/Lists/ByStatus/AllItems.aspx?FilterField1=Status&FilterValue1='+x,'','width=1000');
			}else if(chartID==='MyChart2'){
				window.open('/test/English/Charts/Lists/Coffee2/AllItems.aspx?FilterField1='+y+'&FilterValue1='+z,'','width=1000');
			}
		}
	}
}
Alexander
Hello Alex,
hope your are well?
If got a QUestion, how can i adjust the week with the variables in the CAML to the previous week?
I tried to change the +/- Values, but that didnt make any change.
Michael
Like this:
Alexander
And another thing depending this:
Can i add a CAML Variable Filter and a Filter above the chart (filtering for author) at the same time?
Im alsways getting an error, here the example:
1
2
3
4 {filter:Employee}
5
6
and:
1
2
3
4
5 {variable:thisWeekMonday}
6
7
8
9 {variable:thisWeekSunday}
10
11
12
at the same time?
Michael
Here the code again:
This together:
Where
Eq
FieldRef Name=’Author’ /
Value Type=’Text’
{filter:Employee}
/Value
/Eq
/Where
with this:
Where
And
Geq
FieldRef Name=’EventDate’ /
Value Type=’DateTime’
{variable:thisWeekMonday}
/Value
/Geq
Leq
FieldRef Name=’EventDate’ /
Value Type=’DateTime’
{variable:thisWeekSunday}
/Value
/Leq
/And
/Where
Sorry for the late reply, but I have been busy.
Like this:
<Where>
<And>
<And>
<Geq><FieldRef Name='EventDate' /><Value Type='DateTime'>{variable:thisWeekMonday}</Value></Geq>
<Leq><FieldRef Name='EventDate' /><Value Type='DateTime'>{variable:thisWeekSunday}</Value></Leq>
</And>
<Eq><FieldRef Name='Author' /><Value Type='Text'>{filter:Employee}</Value></Eq>
</And>
</Where>
Read here how to post code in comments
Alexander
Hello Alex,
thanks for your reply, it wasnt that urgent so its Okay.
Also Thanks for the Information on posting code in a comment.
Before i start to try it by myself, i bet its a 2 min thing for you.
How can i change the date from “week” to, “last 3 month” it should be something like getMonth and -90, but im not sure if he is counting that for days or months, and im not sure with the counting for the current month.
Michael
Hi,
Still a lot of email to sift through…
Something like this:
var d1 = new Date();
var d2 = new Date();
var d3 = new Date(d1.setMonth(d1.getMonth()-3));

var todaysDate = d2.getFullYear().toString()+"-"+(d2.getMonth()+1).toString()+"-"+d2.getDate().toString();
var threeMonthsAgoDate = d3.getFullYear().toString()+"-"+(d3.getMonth()+1).toString()+"-"+d3.getDate().toString();

var spjsCAMLvariables = {"today":todaysDate,"threeMoonthAgo":threeMonthsAgoDate};


<Where>
<And>
<Geq>
<FieldRef Name='StartDate' /><Value Type='DateTime'>{variable:threeMoonthAgo}</Value>
</Geq>
<Leq>
<FieldRef Name='StartDate' /><Value Type='DateTime'>{variable:todaysDate}</Value>
</Leq>
</And>
</Where>
Alexander
Hi,
Just wanted to raise possible bug here:
Version 3.1.5 of SPJS charts does not allow setting option of combo chart to:
OPTION: series VALUE: {5: {type: “line”}}
It returns error when chart is generated (Configuration Option error: invalid json).
When downgraded to 3.1, it works fine.
Thanks – it’s great tool though!
Regards,
Kajetan
Hi,
You have to use
{5:{"type":"line"}}To avoid using eval I am using the built in JSON parser in jQuery. Unfortunately the code examples in Google’s pages does not use proper JSON format.
Alexander
Brilliant charting program, just what I was looking for to use in SharePoint. My only headache is working out how to enter the correct options. One headache (for which there doesn’t initially appear to be a solution).
I’m counting (over a month) the number of successfull events using a simple checkbox. When I come to display this in terms of Success and Fail, the legend only shows a 1 or a zero. Is it possible to change the legend so that it reads Success (in place of 1) and Fail in place of zero?
Thanks for any help, and keep up the good work.
Hi,
You find all the configuration options for each chart type by following the link to the right of the “Options” heading in the “Edit Chart GUI”.
As for your chart, add a calculated column like this, and use it in your chart:
Alexander
Thanks Alex, that worked a treat.
I am using this very helpful charts for sharepoint since version 2.4. But suddenly I encounter an error and the charts don’t load anymore. I tried deleting the configuration list but to no avail. The error message is ” Line: 126 Char:3 Error: Object doesn’t support this property or method. Code: 0″ I am using IE7 and Sharepoint 2007.
I need help. Thanks!!!
Hi,
Is it possible for you to try loading the chart using another browser – like Firefox or Chrome?
Are you using the latest release – 3.1.5?
Alexander
Hi Alexander,
I am using the latest release 3.1.5, I am using Firefox 3.6.26 and IE 7.0 in my office. Those are the only browsers allowed. It was fine before and all my graphs were working.
thanks!
Hi,
Do you get the same error in both browsers?
Have anything else changed – like modified master page?
I might be able to spot possible errors if you send me some screenshots – You find my email here
Alexander
Hello Alex, I hope you are well.
I have a problem : when I try to make the Average of a percent field, the result is only made with the left part of the floating value.
Example : when I have this value : 2,56% and 4,21% the result is 3,00% and not 3,36%.
Can you explain??
Many thanks for your great job!
Hi,
I did a test to see what I could find, but in my setup I get 3,39 (which is rounded up from 3,385).
If you could provide some screenshots of the chart configuration, and the source list I might be able to tell what’s wrong.
You find my email here
Alexander
Once again your solutions are amazing! One (hopefully) quick question — how do you do wildcards in the dropdown filters? I want to view a graph for the entire team, and then filter it down to individual member levels.
thanks!
Hi,
I have have added this feature to v3.2. Please test it and let me know if it works as expected.
You find the instructions by clicking the “Filter setup Instructions” above the filter setup textarea in the “Edit chart GUI”.
Alexander
Awesome! Works like a charm; I’d already set mine up with the * so all I had to do was upload the 3.2 version and success!
Thanks again.
Hi Alex,
This is a feature request more than an issue. On any chart where I define my own colours ie. [“Amber”,”Green”,”Red”] to match the corresponding status of items in a list all works fine until the list is filtered or changes to include less than 3 unique status values. ie. if I had only Green and Red items, Green ones would show as amber and red ones would show as green!. Is there a way to link specific colours to specific values rather than just allocating them in order??
Thanks again for an awesome solution!
Jeremy.
Hi,
Sorry, but i do not think I can help you with this one.
Alexander
Alex,
Great product.
I am having an issue with access (?). I set up the chart and have another user access the site to look at the page. Instead of seeing the chart, he gets a blank page to create his own chart. He is also an admin so he has full rights to the site and page. The configuration is SP Foundation 2010 on a hosted environment using Safari, Chrome, and IE.
Gus
Hi, Look at the configuration list – in the title field. Compare the record for your chart with the one created by your colleague. Post back your findings here. Alexander
I apologize for this very basic question. I was able to download the .js files here.
https://files.spjsworks.com/?dir=files%2FSPJS_ChartsForSharepoint%2Fv3.2%2F
But when I try to download the CEWP.txt file, when I click on it, I just get a blank screen. Tried left click, right click, save as, etc. Nothing worked. Not sure what I’m doing wrong. I can open the Version txt file fine.
Any ideas?
Thanks
Mark
Hi,
Try right click and “save target as”.
Alexander
worked brilliantly for about 10 minutes, and now I don’t get any charts rendering, no error messages when i’ve not put in the parameters & using multiple charts only brings up one edit box.
Have tried deleting all of the files and the config list, moving all of the files, even tried installing 3.1.5 instead of 3.2 Totally weird, as all was working really well.
Is there a debug mode so I can figure out what is going wrong??
Hmm, rather odd, seems to have started working again. I suspect it was something to do with the View option, changing away from DEFAULT VIEW seems to cause problems for me.
Alexander
i’m trying to draw a line on bar graphs – just like the combo graphs where we can have a line drawn on columns graphs. Any thoughts or work-around suggestion?
thanks
Clare
You can configure a bar chart using the “combo chart settings” “series” and “seriesType”.
Alexander
Alexander, i tried using combo chart and make SeriesType=”bars”. it’s still showing the “bars” vertically, not horizontally.
thx
clare
Select bar chart and not combo chart in the chart type dropdown. Alexander
Alexander
I tried typing seriesType=”bars” and series={4: {Type: “line”}}, using your v2.9.3.2-packer.js and it still giving me incompatible error.
I see. I tried again and didn’t get it to work.
I’m using your v2.7 SharePoint using Google Visualization API.
I’ve chosen Chart type = Bar Chart (there isn’t Combo Chart in this version of Google Visualization API)
SeriesType = “bars”
series = {4: {Type: “line”}}
I got “Incompatible default series types” error. Would that mean that i need to upgrade the API?
Hi,
The Google Visualization API is the same in all versions of this tool. – it’s referred from Google and not a part of the files you download from me, and therefore the “series” and “seriesType” parameters should work.
You should however upgrade to v3.2 and test it by setting up a working Combo Chart. Then flip the “Chart type” select to “Bar Chart”.
Note that you will have to reconfigure any “filters” for charts you have configured “pre v3.0”.
Alexander
I love this script, thank you!
However, It works for me but does not show to other users.
I am using a Current User filter for a list on the page as well as a filter within the charts for the same purpose. The list shows for other users and other page administrators can see the web parts in site edit mode so the page seems to be okay.
I have tried changing the edit-access to give the group access but that didn’t work either.
Suggestions (if you have a chance)?
Hi, This solution requires Internet access as some files must be referred from Google. Could this be the case? Alexander
Thanks for the reply Alexander. As it turns out this problem was strictly between keyboard and chair.
Note to self: CHECK IN files.
Hi, when I click the CEWP.txt files they all appear blank.
Right click and “save target as” – or view source of page. The browser reads this files as HTML.
Alexander
Works a treat now, regars, Tony
Hi Alexander,
is there a way to auto refresh the chart webpart?
thanks
britta
Hi,
Not in the GUI, but you can add this to the CEWP code:
setTimeout(function(){
   location.href = location.href;
},10000);
This will refresh the page after 10 seconds.
The rather odd “location.href = location.href;” is used to ensure you do not resend information to the server if you have edited any webparts in the page during your “stay”.
Alexander
Hi Alexander,
Thanks for a very powerful solution!
I upgraded to 3.2 in order to use “Show All” in the drop down filtering. Initially it worked great. However, I receive a CAML-query error once I started using site columns in my list. Is this a known limitation or do I need to modify the FieldRef Name?
Claes
Hi,
You must ensure you have the correct FieldInternalName. Read here how to find it. There are no known limitations here.
Alexander
Hi Alex, I just want to let you know that i am working on some improvements in your script. My goal is to let users click on a chart area and be redirected to a specific Sharepoint list, filtered to match the clicked chart area.
I intend to do so by using the event “select” of method addListener.
it has to be something pretty straightforward but so far I have not manage to make it work.
e.g.:
google.visualization.events.addListener(pie_chart, ‘select’, function() {window.open(http://mysharepointsite.com/mylist/filteredview.aspx?parameter)})
Any comments on that would be appreciated.
Best regards,
Paulo.
Just found the spot! Line 1350.
Hi, I have implemented a “listener” in the solution already, but this feature is not available in the GUI. Read this post on how to use a function in the CEWP code to pick up the necessary triggers to redirect to a filtered list
Alexander
the only reference to “listener” I got from a code search is here:
		if(typeof(chartSelectionHandler)!=='undefined'){

			google.visualization.events.addListener(chartObj[config.myChartId], 'select', function() {
				chartSelectionHandler(data,chartObj[config.myChartId],config.myChartId);

			});
		}
but i couldn’t use it.
I just finished the script and here it goes:
		google.visualization.events.addListener(chartObj[config.myChartId], 'select', function() {
		    var row = chartObj[config.myChartId].getSelection()[0].row;
		    //i have more than one chart in the page, so i have to select witch one is being clicked.
		    var urladd;
		    switch(config.myChartId){
		    	case 'MyChart1':
		    		urladd= "byquarter";
		    	break;
		   		case 'MyChart2':
		   			urladd= "bytech";
		   		break;
		   		case 'MyChart3':
		   			urladd= "byindustry";
		   		break;
		    }

//open the url
		    window.open('https://ts.accenture.com/sites/tgpindres/Proposal%20Factory/Forms/'+urladd+'.aspx?param='+data.getValue(row, 0))
		});
I hope you can use it and implement in a future release.
Best regards,
Paulo.
It is indeed kind of tricky to implement it in the UI because you have no way to know upfront witch options (i.e. columns) you are going to map urls.
I will try to figure it out and if i have clue i get back to you.
Alex, I am using a Document Library as a source for a chart and it seems that the chart only plot the first 30 points, although I have more than 30 files in the document library.
I have tried to check possible filters or item limit for the view but everything seems to be ok.
Does your script have any limitations regarding the number of points it can plot?
Hi,
A document library has “paging”. Edit the view, scroll down to “Item limit” and the setting “Number of items to display”. I guess this is set to 30, and that “Display items in batches of the specified size” is selected.
Set this to whatever number of items you want to view, or use a custom CAML to work around the item limit.
Alexander
Exactely! Thanks for your help.
Hi Alex,
My question have little to do with the Charts, but i think I can use your script to get over it.
Im trying to implement a KPI (key performance indicator) to track the average time that it takes to submit an order in my system.
I track this info in a List where I have 2 data fields “Order Start” and “Order End” and trough a calculated column I can get uniquely, for each record, the time to submit (End-Start).
Problem is, i cant get the calculated field to appear in the Totals list field, where I could use the average to came up with the KPI value.
Do you know anyone that have done something like it? If once I could query the list using SQL, i could use select average(submit_time) from orders… but I couldnt find any CEWP implementations that allows one to do such thing.
Sorry for the off-topic.
Regards,
Paulo.
Hi,
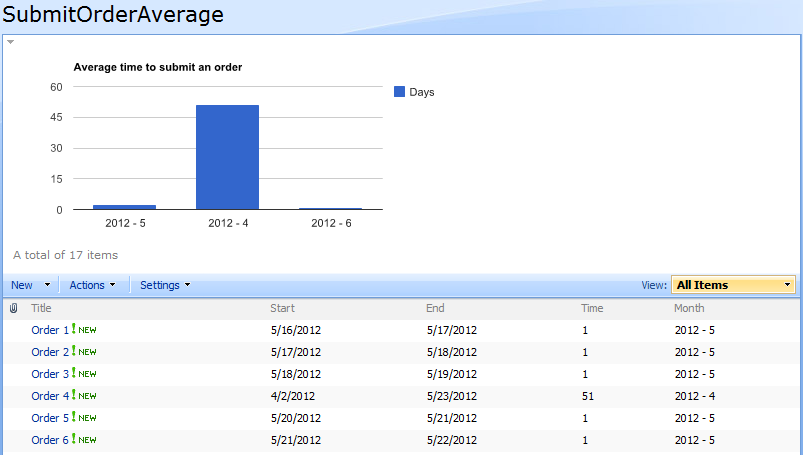
You can achieve this by setting up a chart like this:
Alexander
Hi Alex, thank you a lot. The solution you proposed worked very fine.
I just bought your book from Amazon Kindle and it is a very good resource i think will help me and my coworkers maintaining our sharepoint sites as well as implementing new user requests.
Best regards and keep the good work.
Hi Alex,
When trying to implement the latest code on a site I’m getting the prompt to creat the configuration list but on selecing ‘OK’ it then comes back with an error – “Error creating list: undefined”. I notice you make reference to upgrades on multilanguage installations which I think may relate to my problem but I’m unsure what you mean by “Ensure you have selected the “native” language for the site collection..”.
Any assistance apprecited, thank you.
Jeremy.
Also of note, it confirms the list has been created, but still then pops up the error. The list has been created but is empty.
If your portal is English, with Norwegian language pack, ensure you go to the “welcome menu” and select “English” before you load the page with the chart that triggers the upgrade.
Alexander
Hi Alex, it’s a hosted solution so I’m not sure i ever get to see that menu. I’m assuming as its hosted it’s also US English. Previous versions work fine and I’m sure I’ve had the latest version working on some team sites but it just wont play on others. Anything further I can do to debug?
Thanks.
Hi Alex, now identified that jquery 1.4.4 is loaded earlier in the page by my master template. Now trying to identify a way of forcing your code to run with 1.6.4 or later alongside the earlier version. Any thoughts?
Thanks.
Hi,
Try adding this to your CEWP
alert("Original: "+$.fn.jquery);
jQuery.noConflict(false);
alert("Overridden: "+$.fn.jquery);
You might try passing “true” as argument to the noConflict-function.
Alexander
Thanks Alex, managed to get that to work eventually!
Jeremy
Hello Alex,
its me again, if got a Question:
Im using a Calendar with Categorys, if got 10 Categorys and just want to filter out 4 of them, therefor i added the Categorys to my Chart-Config.
I added a column to but out the Title if the Category is true, so i got it to work to but out the Titles in the Chart instead of the Categorys.
The Problem is:
1. The Chart is always printing out the Categorys i choose, but also but out the Categorys merged together i dont choose.
2. Is it possible to set a specific color for the output (for all items in Category 3-> green, for all items in Category 4->blue…)
3. How can i but out All Events starting at the beginning of this year until today?
Thanks for your help again!
Michael
Hi,
1. Create a filtered view in the list and use that as source for your chart.
2. You cannot “bind” a color to a specific category, but if you always have 4 categories, you can add an array of colors as an option in the chart configuration.
3. Add this code to the CEWP (the one for the chart setup)
// Get todays date
var today = new Date();
// Convert the dates to ISO8601 format: yyyy-mm-dd for use in CAML
var thisYearStart = today.getFullYear().toString()+"-01-01";
var spjsCAMLvariables = {"thisYearStart":thisYearStart};
Use this as “Custom CAML” for your chart:
<Where><And><Geq><FieldRef Name="Date"/><Value Type='DateTime'>{variable:thisYearStart}</Value></Geq><Leq><FieldRef Name="Date"/><Value Type='DateTime'><Today /></Value></Leq></And></Where>Alexander
Charting requires more numeric columns than I have available. I was hoping I could map text values to numbers somewhere, but I’m not seeing how to do that (“Not started” = 1, “Request sent” = 2, etc). How would one address this problem?
Create a calculated column with a formula like this: =IF(Status=”Not started”,”1″,IF(Status=”Request sent”,”2″,”N/A”))
Alexander
Thank you. I have now done this, using Christophe’s concatenation trick to make a nesting of 10 conditions. Works wonderfully.
Hi Alexander,
I have updgraded from an earlier version of your charts in the hope to solve an issue I was having (also so that I could use multiple filters) but it seems that not even this version will do.
The problem I am facing is that some of my filter options have single quotes, like
“Alexander’s Charts”
The chart returns no values, looking at the soap post in Firebug I see that the CAML is constructed like so
“Alexander”
As in, the single quote is taken as a string delimiter. Escaping it
” ‘ ”
raises an error in JSON parsing. Not sure at all what to do.
Do you have any suggestions?
Other than that, your script is awesome.
Thank you.
Vinz
Not an ace at JavaScript, but I think the problem is with jQuery .val() when getting the filter values from your GUI to populate the option dropdowns when the chart is then generated.
Entering the option values with apostrophe/single quote escaped with ' seems to be it.
I’m actually looking at it right now. I’ll try to find a fix and update this article when it’s published.
Alexander
Hi,
Could you test v3.2.2 to see if you get it working?
Alexander
Hi Alexander,
3.2.2 works absolutely great!
Thank you very much for finding the time to look into it.
I also see you have fixed an issue I noticed with an earlier version whereby filter options were not saved if entered in Firefox. I am very pleased about it.
You are a star!
Vinz
Thank you 🙂
Alexander
Enjoy your pint, well deserved 🙂
Thanks 🙂
Hello Alex,
I’ve just managed to get the Charts to work in my area – Thanks for this great little script.
I’m trying to get multiple charts to open on a single page to make up Dashboard but it only displays that last chart that I add. I’ve edited the CEWP text to have different ID’s but all I get is two GUI edit arrows stacked on top of each other. Do I need to have seperate .JS files for each chart?
Thanks for your efforts
To have multiple charts in one page, edit the CEWP code something like this:
Alexander
Thanks for your quick reply.
So far I have not been able to get it working, the SPJS list created the new items, but the CEWP with the .txt attached remains empty. I’ve also tried pasting the text into the html editor but this did not work either. I well, I will try again next week. I’m using jquery1.7.2 is that a problem?
Hi,
You are supposed use one CEWP with script calls in the page. Not call the script multiple times. The charts you want to display must have an unique container ID, which must be in the array “arrOfChartContainers”. This container must be present in the page, but can be placed in another CEWP (without the script calls).
If you place containers in another CEWP, ensure that the CEWP with the script is placed in the bottom right web part sone in the page.
Alexander
Thanks – I’ve got it working, though I don’t get the Edit GUI arrow on the 1st and 3rd charts (using the 4 cell table) unless I have two CEWP’s with the script on the page (then the 2nd and 4th get two arrows).
Also note that the charts are stacked vertically, but maybe I need to play with hard wired cell dimensions. I’ve got something working so I’m happy.
I have a question relating to Slideshow for SharePoint which I will post on the blog page https://spjsblog.com/2011/02/20/slideshow-for-sharepoint
Hi
Just wanted to know how you were able to do this stacking of charts with central filter control.
Hi,
I am having an issue with ‘Treat zero values as null’ not working.
I tick the box, save the changes, but the chart does not change and when I go back to the options – the tick box is unticked,
I am using v3.2.2
thanks
Tom
Hi,
In which browser are you experiencing this bug? I cannot reproduce the behavior.
Alexander
my apologies
i was using the wrong version, it is working as intended in 3.2.2
Thank you for all your work.
Please advise how to do a CAML to show items only if its not null
Alexander
Hi
Thanks for the brilliant code we’ve been able to incorporate a hand full of graphs into our stat’s logs. I’m using version v3.1.5 (February 21, 2012), and don’t particularly want to change it as up until today it’s simply worked. Today however it doesn’t, all my users are experiancing an Invalid Agrument error in place of the graphs, however if you look at the graphs on the server using a service account they’re fine.
We’ve a few ideas of where to start, unfortunatley weren’t been any updates to the system last night, and I’m using an admin account and get the same error, so those ideas are dwindling rapidly.
Any ideas on whatelse could be causing this to happen?
Thanks
David
Please send me a screenshot of the error message.
You find my email here: https://spjsblog.com/about/
Alexander
I use SPJS_ChartsForSharePoint_v3.2.2. I try Combo Type report but i get error ‘Parameter: series SyntaxError: JSON.parse: expected property name or }’
It is bug ?
I set series value is {5:{type:”line”}}
Hi,
Read the “Note on configuration option” at the bottom of the article. You must wrap the property name in double quotes like this:
{5:{“type”:”line”}}
Alexander
Hi Alexander! Your JS is great! It saved my life! I have just one question now: how can I add a filter or exclude items from a chart if they have a specific value. Example:
Issue | Stage
Issue01 | 1 – In Progress
Issue02 | 1 – In Progress
Issue03 | 1 – Escalated
Issue04 | 3 – Close
Issue05 | 3 – Close
I just want to have in my charts issues that are in progress or escalated (that means also exclude all issues that are closed). Thanks!
In fact, I have another question. I’m having problems when creating a Pie Chart. I have a list like that:
ISSUE – WEEK01 – WEEK02…WEEKN
Issue01 – 89 – 45 – 12
Issue02 – 89 – 45 – 12
IssueN – N – N – N
The numbers in my list means customers affected by this issue each week. I can create the chart, but the WEEK and ISSUE are reversed. That means, hAxis is the name of the issues, when it should be Weeks. And the lines are the Weeks, when it should be the name of the issues. Not sure if I was clear, and I can’t paste an image here. Thanks again! Brilliant work! 🙂
Ok, I might need to buy your tutorial or something, because I’m not getting to configure the charts the way I need. 🙂 They are working, but I’m not being able to change color of text on legends, and so on… Do you have a tutorial like that? I would like to buy even in digital form.
Alex, I have a sharepoint list with columns of choice (yes/no) type for each month (Jan through Dec) in an year where user checks boxes for each month. I want to render a chart to show monthly values. When I used column or bar chart I don’t see columns/bars in the chart (it’s empty). I see a legend, false/true on x-axis and 0-1 on y-axis but no bars/columns. What options I should choose in the configuration. I am using v3.3.
Hi,
I need a screenshot of the list you use as datasource to be able to help you with this one.
Alexander
Hello Alexandre,
Awesome solution!
I was trying to figure out how to create a dashboard using your solution and seem that the secreat are in the CEWP code.
I looked the solution you have provided to Jean Pierre using a table and actually using the last version 3.3 I was trying to using the alignment on the , but when I use filters on my chart looks like the filter field does not follow the div alignment, probabbly this is set up in another div inside your code, is this make anysense?
Alexander..
I am trying to align it on the div and happens what I told you below, it seems that the filters do not follow the div alignment
Hi,
Use a table to align the containers:
Alexander
Thanks Alexander.
That solved my problem.
Just for curiosity, it is possible to have your solution working together with the Christopher’s solution (Easy Tabs), if so we would consider to create a script for each CEWP and the containers should have unique ID’s?
Regards
Just for curiosity, it is possible to have your solution working together with the Christopher’s solution (Easy Tabs), if so we would consider to create a script for each CEWP and the containers should have unique ID’s?
Regards
Hi,
This should work, but you most likely must render the charts before you apply the tabs as there is a bug that occurs when you render a chart in a hidden container (missing y axis).
Alexander
Interesting “behavior”… Note that the recent versions of the Easy Tabs don’t hide a container, they just move it offscreen. This subtle difference is explained here:
http://blog.pathtosharepoint.com/2011/05/03/easy-tabs-and-accessibility/
Hi Christophe,
In that case I guess it will work without problems.
Alexander
I have tried to adjust Easy Tabs with SPJS but I am not able to have it working.. not sure but the tabs are not even created.. any sugestions?
HI Renan,
Did you ever get The Easy Tabs to work with SPJS?
I am trying it out but running into difficulties
Hi Alex,
Thanks for a wonderful blogs.
i am new to sharepoint. So need some help. I want to create multiple chart view of the report. My report contains. Name and the score for each person of different levels(say level A, Level B.. ). I am able to create a columnchart view for Level A, Level B seperately. But i need to display all the report in same page for all the levels.
So can you please help me on that.
Hi,
Look here to learn how to render multiple charts in one page
Alexander
Hi. Really (dumb) quick question. Will the solution work on SP2007?
I know, I know, you dont need to tell me…. 🙂 We are moving to SP2010 but still have P2007 for the moment.
I have followed the instructions on a SP2007 site but dont get prompted to create the configuration list…
Thanks
Paul
Yes, it will. Check the script src in the cewp. Alexander
Hey Alex,
Great tool! this is SO much better then using the Office Pivot Tables webpart! One issue we seem to be experiancing is that theres anywhere from a 30 second to 2 minute lag now when loading the page, durring that time the page is fully loaded minus the graphs and is unresponsive. I’m running 3.3.1. Thoughts?
I also tried several other versions and bringing jsapi and jquery in house and the results didn’t change.
forgot to mention this is on IE7
Hi,
This has to do with the fact that all data must be downloaded to the client before rendering the chart. Look at v3.3.5 for a “please wait overlay”.
Alexander
Thanks a lot for sharing this solution.
I am trying to animate the gauge chart by adding animation.duration and animation.easing options. These options doesn’t seem to affect the chart and the gauge pointer doesn’t animate.
Did anyone encounter this problem?
Also, can we change the color of the pointer in gauge chart?
Thanks again!
Great tool, thanks! I’m also trying the animation options for the column chart, but these don’t seem to do anything either. Is this a know issue?
Thanks
Hi,
Sorry, but to have the animation work, you must edit the source code in the file “SPJS_ChartsForSharePoint_vX.Y.Z.js” file.
How is it you trigger the change to the chart data that you want to animate?
Regarding the graphics of the gauge: I do not think it is possible to change it as it’s not an image, but SVG or VML.
Alexander
Sure, Alexander. Thanks for the reply.
Trigger? I thought it would animate just onload or something? Can you give some directions in where to enable animation in the SPJS_ChartsForSharePoint_vX.Y.Z.js file?
Thanks!
Peter
Hi,
The transition animation in a chart is used to animate the transition when changing the chart data. In my implementation of this chart tool, there are no transitions as the data is not changed, only created.
I will look into adding support for transition animation when applying filter to a chart, but as it stands now, you cannot use transition animation because there are no transition.
Alexander
I’m using a filtered view as my data source, but it always uses data from the default view instead. Has anyone else attempted to use filtered view as their data source?
If you use Custom CAML, this overrides the selected view – is this the case?
Alexander
Hi again,
By filtered view , do you mean a filter with a filter web part – like “current user filter”?
If so, this filter is not applied to the chart.
Alexander
“If you use Custom CAML, this overrides the selected view”
That was my problem. I’m having a lot of luck building the custom CAML queries with U2U CAML Query Builder.
I’m just using the “Create filter(s) above the chart” option. I’m wanting to apply that filter to multiple charts on the same page by using the following code in the filter: “filterAdditionalCharts”:[“MyChart2″,”MyChart3”] and inserting “{filter:Market}” (my filter variable name) into the value tags of MyChart2 and MyChart3.
However, whenever I use the variable to filter the other charts – it makes the charts get stuck on “loading”. I have “alloweval” set to true in the CEWP.
Hi,
It seems I might have broken the “filterAdditionalCharts” setting in an update…
I’ll look into it.
Thank you for the pint.
Alexander
This issue should be fixed in v3.3.7.
Alexander
That works! Thank you so much for fixing that.
After I update v3.3.7, urlKey filter does not work.
Sorry for the delay. I actually introduced a new bug in v3.3.7 that broke the filter if you did NOT use “filterAdditionalCharts”.
This should be fixed in v3.3.8.
Alexander
I’m able to get filters in 3.3.7 to work with SP2007 without “filterAdditionalCharts”, however none of the filters would work in SP2010. Maybe that’s the bug you’re talking about?
When I upgraded to 3.3.8, it broke all of the charts for IE7 (unfortunately this a lot of our users). Only the arrow in the upper left would appear (no chart). However, it did work in Chrome.
I also have a chart that uses a list with ~18000 records and it takes a while to load in IE7 – but it will load successfully. For some reason those pages with tons of records completely time out in Chrome and IE9.
Hi,
Do you get any errors (exclamation marks in bottom left corner) in IE 7? If so, double click the exclamation mark and post the error message.
Alexander
I think it was my error. I set it up again and it worked just fine with 3.3.8 in both SP2007 and SP2010.
It also fixed the issue with timeouts in Chrome and IE9 for the charts with an extremely large pool of data. (or maybe my sharepoint server is just running fast today and not taking long enough to timeout?)
In IE7 selecting multiple items with multiselect gives: ‘customCAML.match(…).1’ is null or not an object
I tried downgrading to get Chrome and IE9 to timeout on the charts that use tons of data – but it worked with the old version too. My sharepoint server is just having a good day today.
It’s weird how IE7 and IE8 will keep loading if the load time is more than 10 seconds, but Chrome and IE9 seem to timeout.
When I put whole numbers on the X axis, they come out looking like this: http://imgur.com/swU65
The same thing happens when I use string type for the column.
I tried the following (did not work):
var chartOptionOverride = {“MyChart1”: {hAxis: {‘format’:’#’}}};
Also, I tried using the NumberFormat field in SPJS charts and it did not work.
http://i.imgur.com/wJ8tH.jpg
Using “Options”: vAxis.format works, but hAxis.format does not for some reason
This might be sort of a sharepoint issue. Here’s what the value looks like when I query the list:
float;#40.0000000000000
Maybe there’s a way to make CAML convert that float value to int?
Hi,
I suppose you use a calculated column here, and in that case, you can add a whitespace to the formula in your calculated column to trick SharePoint to format the number differently:
Hope this helps.
Alexander
Hi Paul,
Thank you for the beer!
Alexander
Hi, Thanks for making a great and easy to use charting tool for SP, I only have one question (and it may have already been answered) How can I get the chats to appear side by side on the page rather than on top of each other when using multiple charts? I’ve tried changing the div tags, and putting them into a table, but no joy.
actually scrap that, I had an error in my css table :-S
I wanted to dynamically select an item from the filter drop-down, here’s how I did it: http://paulsprogrammingnotes.blogspot.com/2012/11/spjs-charts.html
Know what would cause the “Hit error fn!”?
It only happens on IE7, and the page still works after clicking past the error.
Woops, the thing that triggers the error is not inside of the SPJS code.
I’m not sure if your sharepoint will have it, but here’s more info if you’re interested:
The error message seems to occurswhen sharepoint fails to log user activity, it’s inside of . For some reason it only happens in IE.
Here’s how I stopped “Hit error fn!”: http://paulsprogrammingnotes.blogspot.com/2012/12/stop-ie-alert-messages.html
Something which may make spjs charts more intuitive to new users, is changing the code for “Prefill textarea from choice field:” to allow for filtering by text fields also.
Alexander,
I can’t get the chart configuration screen to open. The configuration list was successfully created. The Form Web Part holding the “MyChart1” container says “Loading Edit Chart GUI. Please wait….” and it just stays on that indefinitely.
The IE Dev Tools error console has this error in it:
“SCRIPT5007: Unable to get value of the property ‘join’: object is null or undefined
SPJS_ChartsForSharePoint_v3.3.6.js, line 2965 character 8”
Do you know what this one means? Thanks!
Hi, i suspect there is another script in the page interfering with the variable “fht” defined in line 2554. Try changing all occurrences of “fht” with another name to test it.
Alexander
Thanks for the reply! I replaced fht with fhtNew in every occurrence, but there was no changes. I still see the “Please wait…” forever. Also, I have no other scripts running on that page except the ones in the sample CEWP.
What is the Google jsapi script for again?
The jsapi is the script that generates the charts. This must be referred from Google, and you must be “online” when using this solution as you are not allowed to download the jsapi files locally (Google terms of use).
Have you been successful implementing this chart solution in another site?
Alexander
I implemented one of your first versions on SP2007, but haven’t tried since we migrated to SP2010.
There can be incompatibilities if you have modified the master page or other customizations. Is your SP2010 system standard, or is it enhanced / modified in any way?
Alexander
The only master page modification is a reference to pick up another style sheet. We have a custom branding site feature, but I turned it off to test the conflicts I was having with the vLookup script on another list. Otherwise everything is plain old SP out of the box. (as far as I know)
Could it be a conflict with multiple instances of jQuery being loaded? – maybe one version is loaded in the master page?
Alexander
Hi Alex.
Great tool (I bought the book!).
Problem: On the chart configuration, the column listing doesn’t show all the columns in the selected list.
Am i missing something?
Hi, What column type is thee ones missing? Alexander
Hi, the column type is decimal.
thanks
Is this a standard SharePoint column and is this the only one missing?
Alexander
It is an external list from a view in separate SQL database. I tried other external lists… I can see everything apart from decimal typed columns.
To get me going, i am directly editing the entry in the chartcols field in the ‘SPJS Charts for Sharepoint’ list.
Hi,
Sorry for the late reply. I have not tested this with external content types, but you might be able to get this working if you look at the function “customGetListFields” and the array “arrOfTypesToIncludeInNum”.
Alexander
Quick Question: How do I maintain the title if the graph is empty (no records)? The title should persist even if the graph is empty.
I got a work around for the titles… I am not using the graph title… instead I just edited the CEWP script and put in the titles as text within the ‘divs’ / tables.
HI Alex.. quick one: How do I hide the legend.. if I don’t want it displayed?
You have to put it in the override variable in the CEWP, it looks something like this:
var chartOptionOverride = {“MyChart1″: {legend:{position:’none’}}};
Hi, You can use option: legend and value: none Alexander
Paul,
Thank you so much!
It works with the legend also under quotation marks i.e.:
var charOptionOverride = {“MyChart1”: {“legend”:{position:’none’}}};
pardon my limited jquery knowledge:
I have multiple charts… i tried to enter the same expression multiple times (with respective chartIDs) but it only executes the last one.
Am i missing something?
Thanks
With multiple charts, it would work like this (make sure you change MyChart1 to the real ID of each of your containers):
var charOptionOverride = {“MyChart1″: {“legend”:{position:’none’}}, “MyChart2″: {“legend”:{position:’none’}}, “MyChart3″: {“legend”:{position:’none’}}};
Paul,
No worries… I used the chart GUI options. set legend.position to none for each of the charts and it worked.
Thanks!
I think it is easier (for maintenance) to edit the CEWP… so perhaps I will go with your solution.
HI Alex,
I am using tables to display multiple charts. I would like to collapse or hide the cell container if there are no records. This is to avoid the “no items found” box that appears.
How can i go about this?
thanks
Instead of hiding the cell container, i used a blank chart.
When I try to access a spjs chart (3.3.8) in safari, it gives the “Configuration list missing” error. I press cancel on that because I don’t want it to overwrite anything. After I press cancel, the console says “/_vti_bin/lists.asmx 400 (Bad Request)”.
Hi,
Is this Safari for Mac or Windows? Does it work in other browsers? Does it work with versions before 3.3.8?
Alexander
Thanks for sharing this! I have been able to get everything to work on my pie chart expect for one option. I can’t get the “pieSliceTextStyle” option to work. Here is the option value that I’m trying now but I’m having no luck: {color: ‘black’}
Alexandar had answered a similar question in an earlier posting… see Michael’s question above. It is to do with using double quotes.
Hi,
Any way to prevent IE from leaking memory? Using a simple line chart it consume ~50MB after each refresh and that memory is not released after.
Hi, I do not know if this is possible. The memory will be released if you close the tab. Do you run out of memory? – if not, IE will consume more memory if you have a lot of memory available.
Alexander
Hi Alexander,
I really appreciate all the work you’ve shared.
I’m having a couple issues and looking for suggestions. I’m using the CEWP and SPJS Charts For SharePoint v3.3.8 on a SharePoint 2010 foundation site.
I have followed the instructions you provided regarding setup of these files and the charts. I’m having the following difficulties
Launching the page prompts for the creation of the configuration list, however the list created is empty.
I have included your recommended code for troubleshooting when script does not work, and I receive the following messages:
“function” and then “undefined”
I should warn you that javascript is not my native language and I am trying to learn as I go.
Any recommendation for my next step is appreciated.
Thanks
Hi,
When the list is created, it is empty. You have to configure a chart and save it to add an entry to the list. What kind of errors do you get? If you hit F12 in IE you can bring up the console and look for errors there.
The two alerts is OK I guess – if you did not change the “InsertTheFunctionNameHere” in the second alert.
Alexander
Hi Alex,
Do you have an option in the SPJS for exporting graph data to csv or excel? thanks
Gilbert
“you can have parts of, or even the complete filter as a variable in the CEWP.”
Woops, didn’t complete my question.
Can you show an example of a filter as a variable in the CEWP?
Hi,
Sorry for the late reply.
To use a variable as filter, you must set the parameter “allowEval” to true, and then you include the filter using the same syntax as described in the “Instructions” over the filter setup textarea like this (in the CEWP code):
var allowEval = true;
var myFilter = [{"label":"Category","urlKey":"Category","multiselect":false,"size":3,"options":[{"f":"Category 1","v":"Category 1"},{"f":"Category 2","v":"Category 2"},{"f":"Category 3","v":"Category 3"}]}];
In the Filter setup textarea, you insert the variable name: myFilter.
The filter can be generated by javascript in the CEWP as long as the syntax is correct.
Alexander
I’m trying to create a line chart to show the average resolution time per category by assigned team. I can show the average resolution time by assinged team (vAxis = team, yAxis is set to average a column of resolution time in days). But I want to add a third dimension to calculate the averages based on the list item’s category. Is this possible?
fields:
Assigned team (string)
Resolution time (integer)
Category (string)
column 0 = assigned team…string – merge duplicates
column 1 = Resolution time…average
do i add Category as a 3rd column in some way?
Hi,
I do not think this is possible as you cannot have multiple categories / dimensions in one chart. You will have to make two separate charts.
Alexander
Hi Alex,
I’m using your solution to create a dashboard of charts and tables and it’s working great!
I have one issue I can’t seem to resolve. I have a table of which I’m trying to sort by the first column using sortColumn and sortAscending. It works for every column index except when I chose sortColumn 0. I don’t get an error however it won’t load the chart or table. I’ve tested various fields in my list as the first column and get the same results. If I set sortColumn 1, it sorts the 2nd column perfectly.
Any ideas?
Thanks!
Hi,
This was a bug with the “chart options parser” as the number 0 was interpreted as text. It is fixed in v3.3.81.
Alexander
Thank you so much for looking into the issue! It’s working perfectly in most browsers however in ie, the charts or tables won’t load as soon as I point to the new js file even before attempting to set sortColumn to 0 however loads fine in Chrome or Firefox. Unfortunately my work deploys ie to all staff as the only browser.
I’ve tested quite a bit but am at a loss.
Which version of IE are you using? I tested in IE 9. Alexander
First I tested in ie8 as that’s what they have at work and then I tested in ie9 with the same results.
I noticed today that in ie there was the following error related to the new js file:
‘console’ is undefined
Line: 1461
My bad, I forgot this line in the code!
Remove line 1461 and you are good to go – I’ll update the code in the download section.
Alexander
Thank you so much!! Works perfectly!
Hello Alex,
I have a question about the items total.
I created a list with 31 items, and the pie chart renders properly. but its only showing 30 items.
Is there some lock on how many records can be used?
If you pull the items from a view, and not using a custom CAML, the paging size of your list will limit the item-count and give you only page 1.
Increase the list view item-limit, or use a custom CAML.
Alexander
Hello Alexander,
What a great script this is! I do have one question 🙂
How should the sharepointlist be populated to make a map with 15 Markers of locations?
Now i’ve got the columns: Longtitude, Altitude, Title (contains address) and Establisement.
Hi
This is really nice.
Question I have the following list structure
Value 1 | Value 2 | Value 3 | Notes
3 2 1
I want top have on the bar chart under the bars those labels Value 1 ..3 instead of having it in the legend.
Is there a way to do that ?
thx
I am getting the below error when using “filterAdditionalCharts” option.
——————————————————
[Custom CAML-query filter error]
The custom CAML-query for the chart with id “MyChart2” contains the following filter key: “Month”.
This key is undefined.
——————————————————
What am i missing?
To filter multiple charts with one filter, you must enter this in the configuration for your first chart:
In “MyChart2” you then use the same CAML as you did for “MyChart1”.
Alexander
Thanks Alex. It worked. I forgot to give MyChart2 in quotes.
JK
I am receiving the same error when simply trying to get the drop-down filter to display. Here is the CAML that I am trying to run:
#VALUE!{filter:Submitter_x0020_Location_x0020_FSM0}
That was not the full CAML code…it appears to have been blocked.
Hi,
first of all: great Work!
Now i have a question: Is it possible to add a Rangefilter like that one:
http://code.google.com/apis/ajax/playground/?type=visualization#chartrangefilter_control
in the charts?
thx
Pawel
Hi,
Sorry, but this is not possible the way the charts are built in this solution.
I might change this in later releases, but I cannot promise anything.
Alexander
Hi,
I have multiple column charts in a page with 4 series. While displaying the charts how to make sure the colors of series to be uniform in all the charts.
JK
Alex
I love your google Charts solution. As always you have went above and beyond. I was wondering if it is possible to create a custome CAML filter, to filter by the three views I have created of the list. I have “Coming Due”, “Past Due”, and “Completed 100%”. You will have to forgive me as I am not too familiar with CAML coding. But I would like to do this to filter between the different views in one chart so that I do not have 3 instances of the same chart on one page.
Thanks in advance,
Randy
Sorry for the late reply, comments have piled up…
If this three values is from the same choice column, this is no problem.
If you haven’t already figured it out, answer this comments and I’ll show you how its done.
Alexander
Alex
I ended up going a different route but would still love to see if this is possible. In the list I do not have a choice column for the views I have created. But I wanted to see if I created 3 views on one list(i.e. Past Due, Coming Due, Completed) I could then put the filter there so that you can simply filter by each view instead of a choice in the columns. From what you were saying previously it does not sound like it is possible, but if it is I would love to know.
Thanks Again
Randy
Hi,
If you do not have a choice column to set the status, how are you creating your views (the filter)?
Alexander
Hi Alex,
First of all thanks for all the effort.
I was following your instruction after version 3.0 and can’t seems to get it work.
Here’s what I did.
1. Created a document library and uploaded “SPJS_ChartsForSharePoint_v3.4.js”,”sharepointplus-3.0.3.js” and “CEWP.txt” file.
2. Modified the path in “CEWP.txt” for the uploaded jscript files.
3. Added a content editor webpart and pointed towards the “CEWP.txt” file.
4. Saved all the setting and then error occurs:”An error occurred while creating the configuration container: One or more field types are not installed properly. Go to the list settings page to delete these fields.”
I am not able to solve it.
Any help is appreciated.
Thanks in advance.
Neptune
Hi,
I guess that for some reason the configuration list did not get created correctly. Can you go to all site contents and open the list (SPJS Charts for SharePoint) to see what fields it contains?
If it has the title column only, ensure you have the necessary rights to edit lists, then try saving the configuration again. The solution is configured to automatically create any missing columns.
If you still get error messages, try hitting F12 in IE to bring up the developer console. Look for errors in the “Console” tab.
If you have a MUI environment, ensure you have the default language selected when creating the configuration list.
Alexander
Thanks Alex.
It worked now.
Thank you very much and have a great day.
God bless.
Neptune.
Alex,
Hi! Probably a very simple question but I can’t work it out.
Organizational Charts
latest version of files
when using the formatted version of the “EmployeeName”, it doesn’t appear to use the comma to separate out the name from the formatting, but renders the whole thing, so that I have to use the full formatted version to identify the item as the manager. I’ve tried various substitutions etc but no luck
I have the allowHtml option set to true and the “EmployeeName” in string format. Any suggestions why this might be?
Thanks
Bill
Alex,
I’ve found the answer: use | instead of ,
e.g.
The Simpsons|The Simpsons……
great tool!
Bill
Hi,
I’m not sure where to post this but I’m having an issue with the charts. For some reason, some of my users are being asked to login multiple times which I’m assuming has to do with the charts. I thought I saw a comment or fix somewhere but I can’t find it. Any help is appreciated…
Thanks,
Ben
Hi,
What happens if you hit cancel in the login dialog? does the chart still render?
Alexander
When they hit cancel, the chart does not render. At one point while clicking cancel, it gave an error “An error occured when running the query for the chart: MyChart6.
Another time the Chart configuration came up and under Select list was a message highlighted in red: .
I thought it might be a permissions issue but I gave them contributor access and it still didn’t work.
Are you all accessing the site by the same URL / method? no citrix or alternate access mapping? All are using the same setup regarding browser etc?
Alexander
I believe we’re all accessing the same way. I tested with 2 colleagues sitting next to me. We’re all running IE8 and accessing via the URL I copied from my browser and pasted in emails to them. One person is able to access everything fine. The other is getting the error. There are five other charts and the user getting the error has verified the other charts are rendering.
Try logging in to the SharePoint site with your user account on your colleagues computer. If this works, you have a permission issue. If not, there is a problem with your colleagues computer.
Alexander
Thanks Alexander! You pointed me in the right direction. I was able to login with my user ID and it worked. I was able to narrow it down to the issue.
The issue was caused by a stupid mistake on my part. I had previously pointed the one chart to another sharepoint site which other people didn’t have access to so it was a permission issue.
Thanks again!
Ben
Alexander,
I have another issue that’s hopefully not another self inflicted one. Whenever I use bar or column charts, the labels don’t always show up. The only way I have found to fix this is to refresh the screen. It’s a temporary fix though as the labels disappear again the next time around. Any ideas?
Send me an image of how it looks before and after a refresh.
Alexander
Looked at the image. I have seen this behavior when the chart is drawn in a hidden container which is made visible after the chart has rendered. Could this be the issue?
Alexander
I checked and the webpart is not hidden. Is that what you mean? I tested to see what would happen if I did hide the webpart. The chart did not show.
There are some hidden webparts on the same page. I’ll mess around with the hidden webparts and see if that affects anything.
Are there plans to publish a version that leverages SP2010 REST capabilities? I have found that /_vti_bin/listdata.svc is a much cleaner way to query SP list data which avoids SOAP and having to build a properly formatted query statement.
Hi,
I have not looked into this functionality, but by first look this method is limited to 1000 items. This limit can be overcome by querying in batches of 1000, but I have not tested it.
Alexander
I am having issue with the set up it looks like a lot of code is missing in the CEWP text you have published. There are only links to other js. and not the GUID ID as your original version showed. I am really confused I am running SP 2010 and I am not promoted to make the configuration list or anything. Please HELP!
Did you figure it out? There are no code missing. All configuration is done in the GUI which is presented when all scripts have been referred correctly.
Alexander
Hi, I’ve tried restricting edit access to a specific group of edits (admins), but I’ve noticed that if you don’t have edit access the page keeps asking me for my log in and eventually says it can’t load configurations. I was hoping that someone without access simply wouldn’t see the edit option but would still be able to look at the chart.
All users must have read access to the datasource and the configuration list. This GUI options to restrict edit access it used to remove the edit chart link, but will not alter the rights in SharePoint. To truly restrict this access, break the inheritance of rights for the configuration list and set read access for those not supposed to edit charts.
Alexander
Hello Alexander,
It worked, they didn’t have permission to the configuration list. Thank you.
Hi,
I was able to set up a simple dashboard using SPJS Charts but I’m not sure how I can get the bars to be different columns (i.imgur.com/hOdlIPF.png). Right now I just get one color for everything.
Also, I was wondering if there was anyway at all I can get the code to update as the list updates. I have a list which will be used by multiple people and it would be fantastic if the changes could be reflected in real-time or often enough without having to refresh the page every time.
The reason you have only one color is because you have only one series (column of values). You can however split unique values in multiple columns like this: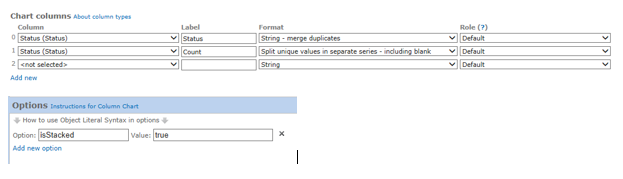
href=”https://spjsblog.com/wp-content/uploads/2013/09/SplitUniqueInSeparateSeries.png”>
The option is called “Counting unique” in your version
To have the chart automatically update your best bet in this version is to refresh the page with a script like this in the CEWP:
var myAutoRefresh = setInterval(function(){
	if($("#MyChart1_chartConfig").css("display")==="none"){
		drawChart("MyChart1");
	}else{
		clearInterval(myAutoRefresh);
	}
},3000);
The text “MyChart1_chartConfig” refers to the chartcontainer with ID “MyChart1”.
In the next version which is near completion, I will build this into the GUI.
Alexander
Hi Marc,
Thank you so much for this. It works perfectly, feels almost real-time, amazing. I spent most of the day trying to figure out a way to have the charts update or get the webpart to refresh and I came up with nothing. This is amazing. Thank you.
This is awesome, thanks for the tutorial. I was trying to setup the stacked columns but couldn’t get it working right.
Question for you Alexander. I know you provided the option to override colors by field value for Pie Charts, but can it be done with a stacked column chart? In my case I am stacking projects by stage and status, so the status colors should reflect Red, Yellow, Green, etc. Otherwise the API is coloring projects in Green status as orange, Red status is green, and Yellow is purple.
You’re welcome
Alexander
I guess a simpler way to ask my question above is if I can specify the color value of the second series in a stacked column chart.
In the next release (in a week or two) this is possible in the same way as for pie-charts.
Alexander
Hi Alexander
I think I have everything setup, but when the chart refreshes, I get the followig error:
Data column(s) for axis #0 cannot be of type string
I have two columns of data:
1 – Stage – which I have selected as number
2 – Name – which I have selected as string
What I am expecting is a Bar Graph with the Names along the X Axis with with Bar showing the Stage against each.
Any help to resolve this would be appreciated.
iain
Try swapping the column positions
Hi Alex,
The filter example given above shows the options entered manually. Can these by selected automatically from the column?
In that case, how would i specify the filter?
Hi,
The dropdown “Prefill textarea from available choice field” can prefill the filter textares from any choice column in the list. When using text fields in a filter, you must click the “instructions” link above the textarea for an example.
Alexander
I keep getting an error when filtering a line chart. I have 3 other charts on the same page using the same filters, but no error.
“Webpage error details
User Agent: Mozilla/4.0 (compatible; MSIE 8.0; Windows NT 6.1; WOW64; Trident/4.0; chromeframe/32.0.1700.107; SLCC2; .NET CLR 2.0.50727; .NET CLR 3.5.30729; .NET CLR 3.0.30729; Media Center PC 6.0; .NET4.0E; InfoPath.3; .NET4.0C; AskTB5.6)
Timestamp: Wed, 5 Feb 2014 22:59:47 UTC
Message: Script error
Line: 0
Char: 0
Code: 0
URI: https://www.google.com/uds/api/visualization/1.0/4ea8b4974b307a4ef65cf50fe2dc4df2/dygraph,format+en,default+en,ui+en,geochart+en,map+en,geomap+en,table+en,orgchart+en,motionchart+en,gauge+en,corechart+en,timeline+en.I.js“
Hi,
I guess you are using the latest version (v4.X)? – you should post questions in this article: https://spjsblog.com/2013/10/02/spjs-charts-for-sharepoint-v4/
As for your question:
Bring up the developer console (hit F12) and look at the console – any more details there?
Is there anything different with this filter – like what field is it targeting, which values are you passing as filter?
If you cannot figure it out, please send me some screenshots of the configuration and the chart – you find my email in the about me tab in the top of this site.
Alexander
Alex,
Have you any plans to include treemap to the list of available charts?
Thanks
Rob
I’ll look at it in and see what I can do in the next release.
Alexander
Alex,
Moved to another customer and trying to replicate my success with using your charts :-). Attempting to use v4 with the following code. “js” is in the Document library but when I run the page, it doesn’t prompt me neither does it create a list. Any ideas?
/*****************************************************
Address all containers
*****************************************************/
// All charts must be represented by a container with a unique id. This container must be present in the page
arrOfChartContainers = [“MyChart1”];
Thank you,
Kirill
Hi,
To show code in a comment you must wrap the code in <code></code>
Do you see any errors in the developer console (hit F12 > Console)?
Alexander
Peter,
Sent you an email the other day with attachments. The only “weird” items I see in Firefox are:
1. Synchronous XMLHttpRequest on the main thread is deprecated because of its detrimental effects to the end user’s experience. For more help http://xhr.spec.whatwg.org/
2. Use of getPreventDefault() is deprecated. Use defaultPrevented instead
Does that help?
Thank you,
Kirill