Forum Replies Created
-
AuthorPosts
-
Phil Grant
ParticipantAH! OK that’s probably it then, I do use the Item limit of 1 and group by project to give me the last document added for each project.
Cheers
ParticipantNo, even if I don’t use custom CAML filter I get the problem, I only tried CAML after the initial Chart displayed too much information.
Phil
ParticipantI’ve come across something that could be linked to the issue above.
When I base a chart on a pre-filtered view from a list, to remove some data that I know has no values, the graph shows all the data on the axis instead only the pre-filtered.
Effectively changing the “Select View” between “All Items” and the pre-filtered view makes no difference.
In the options I’ve also ticked “remove items with no value in the first column”
I can’t really post any images of the graph but if you need something I can sort something out.
ParticipantYes, I tried that but it makes no difference, I’ve noticed it in all my charts.
Could it be something to do with using the substitution and combining some columns together, is it making the width wide enough for all the possible columns?
I’ll try removing the substitute code tomorrow to see if it makes any difference.
Phil
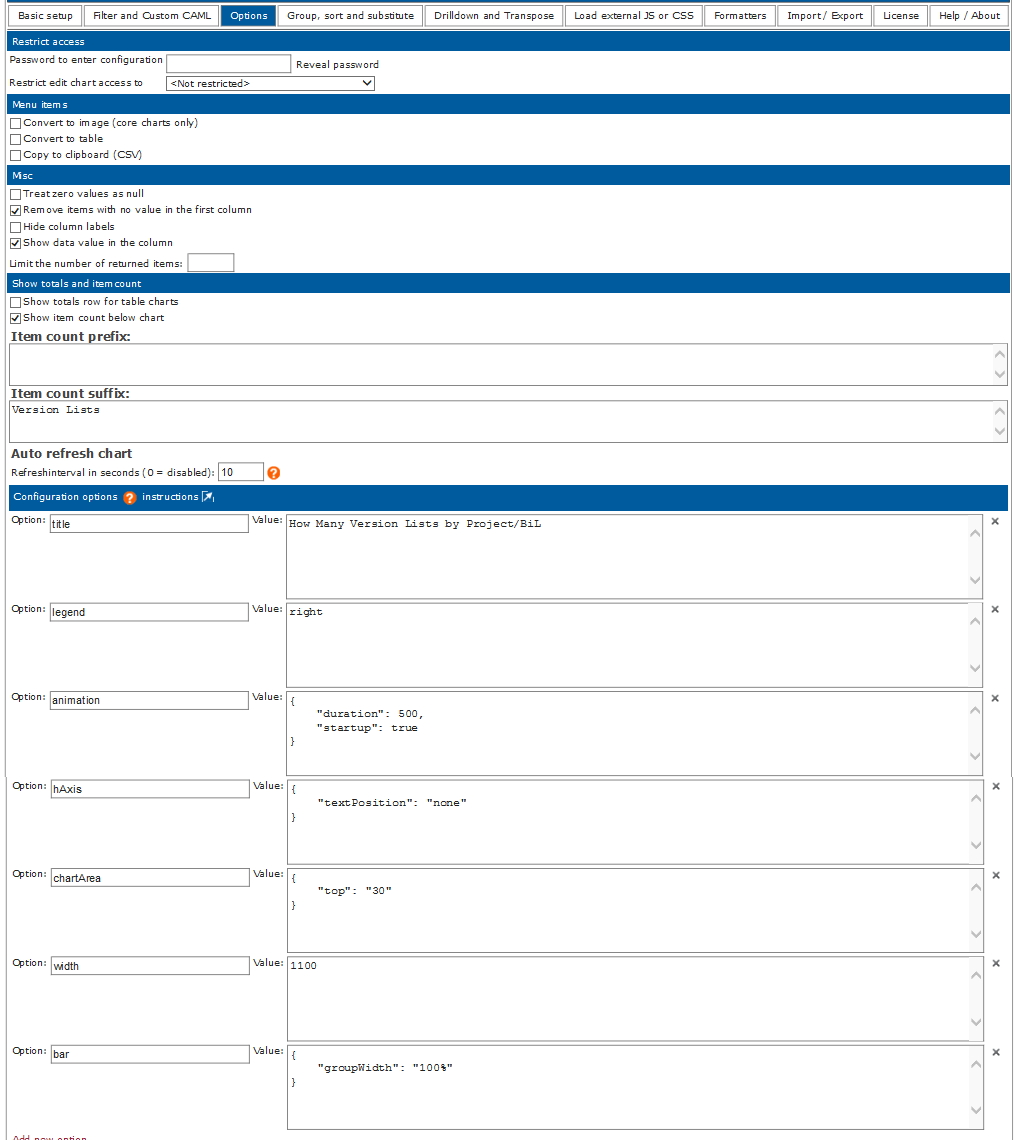
ParticipantHi,
Here are my options settingsAttachments:
ParticipantThanks, I thought as much.
I’ve had a conversation with our IT department and they’ve told me that they will be rolling out SharePoint 2016 enterprise later in the year and phasing out 2010 Foundation, that’s good news but it will mean a task of transferring a lot of content over but at least the Gantt charts will work.Cheers
ParticipantThanks, I got it working but I think there is an issue with the IE version 8 stopping it from working as it works in Google and I get this error (attached) in IE.
If I hit F12 and force document mode 10 in IE it displays the Gantt chart OK.
I guess this is an issue with the Google chart?
Attachments:
ParticipantThanks, I’ll give it a try although I have already tried a custom list with those settings apart from the percentage complete calculated column.
Phil
ParticipantAlexander,
Thanks for sticking with me, I sorted it and found the root cause for my issues.The second series I was using was the ID, as a number and doing a count (not a sum), in your example you were using a title as a number and doing a sum so I changed my second series to a title and changed to a sum and it now works.
Cheers,
PhilParticipantOK, I’ll give that a try, if you don’t hide the x-axis do you get loads of stripey colours making up the columns instead of single colour columns because that’s what I get when I configure it like you, the only difference is I didn’t hide the x-axis.
I try it tomorrow and let you know if I’m succesful, thanks again for your patience.
Phil
ParticipantOK, I do struggle with the concept of creating charts sometimes, I just can’t get how a pie chart can take in one series “Status” and another “Count if ID” then generate elements “slices” and give them different colours after all my (probably simplistic) view is that the bar chart has the same input series as the pie chart and the bars are just elements of the graph so why can they not contain a colour property as per the pie chart.
Unfortunately I don’t have another series to add to do the same as the example with department.
I was hoping to achieve similar to “vary colors by point” in an excel pivot chart.
Oh well it still works well without the different colours, thanks for taking the time.
ParticipantThanks but I assume this is for version 6.1, I’m using version 3.4 although I’m trying to get version 6 up and running and hope to change to version 6.
ParticipantAlexander,
As far as I can see I’m doing exactly as per the video, the only difference I can think of is the path to the loader file is not being found.
The error message contains the correct path the the js file that it says it cannot find I know it’s not the same but version 3.4 works fine and finds the required files OK, is there something different in my company’s site configuration maybe that the loader doesn’t like?
Regards,
PhilParticipantA little mor information for my issue above.
Path of “SPJSCharts_loader.html” = http://”server_Name”/bn00xxxx_engineering/BN00xxxx_ElectricalIntegration/SPJS/Charts_v6/SPJSCharts_loader.html
Path of CEWP page = http://”server_Name”/bn00xxxx_engineering/BN00xxxx_ElectricalIntegration/SitePages/V6ChartsDemo.aspx
text in loader file = “var spjs_charts_scripts_in_current_site = true;”
error =
“The SPJS Charts Ioader failed to load /bn00xxxx_engineering/ BN00xxxx_Electricallntegration/SPJS/Charts_v6/js/spjs-charts.min.jsThe Loader is set up to read the files from a document Library in the current site. If this is NOT the correct location, you must change the variable “spjs_charts_scripts_in_current_site” in the “SPJSChartsLoade.html” file.”
-
AuthorPosts