› Forums › SPJS Charts for SharePoint › Using a pre-define list view
- This topic has 4 replies, 2 voices, and was last updated 7 years, 4 months ago by
Phil Grant.
-
AuthorPosts
-
-
March 9, 2017 at 12:55 #16030
Phil Grant
ParticipantHi,
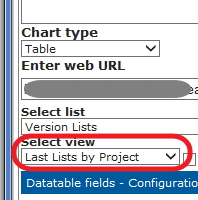
I’ building a chart on a pre-defined List view that I’ve created in Sharepoint, this vie limits the items to a specific project of a specific filetype and groups by project and has a item limit of one.The idea is to give me the latest items for each project but limited to specific projects.
This looks great in SharePoint and works fine but when I use it as the source for a chart I get all the possible projects, If I use CAML for filtering I can improve the situation but I get counts that are much higher than they should be as if the values from entries that should not be included are included.
The SharePoint pre-defined filter effectively gives me the latest item for each project I’ve pre-defined.
Is my understanding wrong, if I have a pre-defined listview should the chart only use this data?
Cheers,
Phil-
This topic was modified 7 years, 4 months ago by
Attachments:
-
This topic was modified 7 years, 4 months ago by
-
March 9, 2017 at 21:07 #16040
Alexander Bautz
KeymasterHi,
If you want to use the list view as source you must NOT use the “Use custom CAML” option in the “Filter and Custom CAML” tab.Is this the issue?
Alexander
-
March 13, 2017 at 11:03 #16092Participant
No, even if I don’t use custom CAML filter I get the problem, I only tried CAML after the initial Chart displayed too much information.
Phil
-
March 14, 2017 at 00:30 #16102Keymaster
Not sure if this is the issue, but when using a predefined view as source for a chart, only the CAML query will be used and not paging or itemlimit settings.
Have you applied any such settings to your list view?
Alexander
-
March 14, 2017 at 11:18 #16105Participant
AH! OK that’s probably it then, I do use the Item limit of 1 and group by project to give me the last document added for each project.
Cheers
-
-
AuthorPosts

- You must be logged in to reply to this topic.