13.08.2011 v1.2 released with these changes to the argObj:
- paging: Use this in conjunction with the next parameter to set the number of top level comments to display initially.
- topLevelCommentsLimit: The number of top level comments to display initially.
- showMoreCommentsText: If there are more comments, this text is used for the link to show the rest of the comments.
- sortAscending: true or false. Used to control the order of the comments.
- commentFormVisible: true or false. Used to have the comment box expanded or collapsed initially.
There are changes to these files:
- CommentBox.js
- CommentBox.css
And the CEWP-code. See the CEWP-code section below for details.
17.07.2011 v1.1 released with these changes:
- Anonymous users can read comments, but must sign in to post.
- Added new parameter “loadLiveProfile” to the CEWP argObj. This defines whether or not to load the profile image and email from the user profile, or to use the values stored in the comment. This will automatically be set to false for anonymous users. To accompany this change i have added some new fields to the configuration list (these will be automatically created when submitting the first comment), and changed the parameters “newCommentText” and “replyText” from string to array.
There are changes to these files:
- CommentBox.js
- spjs-webservices.js
And to the CEWP-code.
I got this request from Brett:
Hi Alexander,
Got an awesome request for your mad skills.
Are you able to provide a Javascript/JQuery code for a Comments Box Web Part? So it can be added to any page, list or library?I’m thinking you could set it like the Poll web part, where the Admin can specify the ID Name for each Comments Web Part instance, which will allow the user comments be allocated to the correct web part.
So it would function exactly like the Comments Web Part in a Blog Site, using the authenticated user credentials and/or anonymous comments if you desire.
There are a few Posts mentioning DVWP’s and SP Designer but I’m hoping to use a Javascript based solution.
I’ve looked everywhere for this function and closest I found was this Post.
http://devgrow.com/simple-threaded-comments-with-jcollapsible/Many thanks for your time and efforts,
Brett
I thought this would be a useful solution for many users – myself included. It’s not very complicated as all comments are stored in a single list – identified by the pages relative URL.
Of course – as i started building – i incorporated this and that, an all of a sudden i had myself a full featured, multi level comment solution.
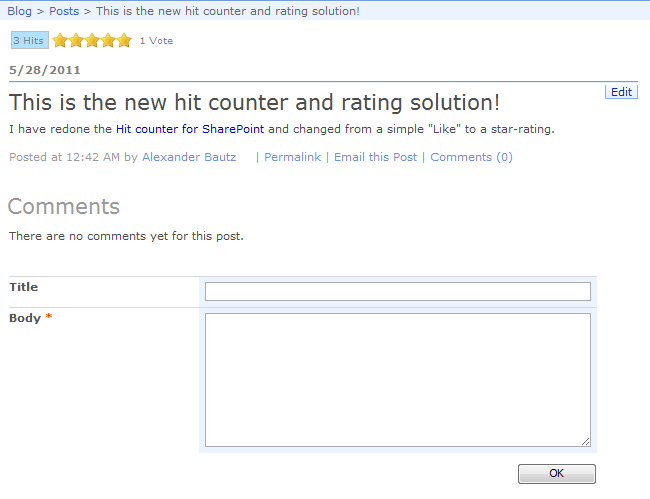
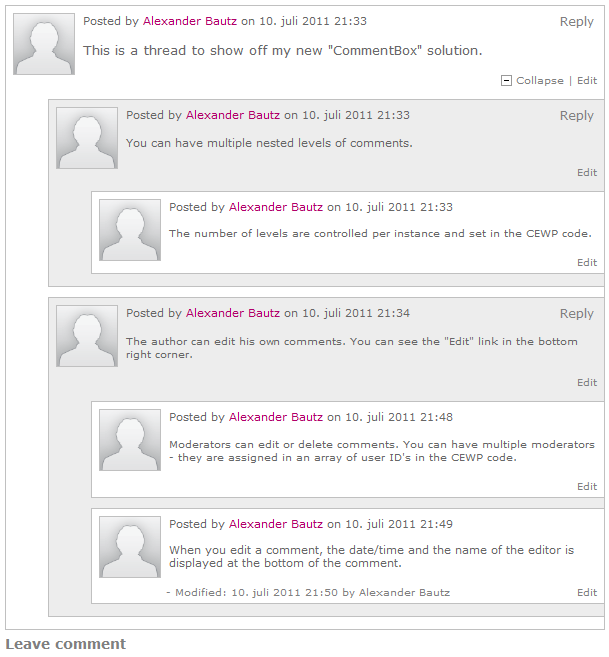
Sample thread:
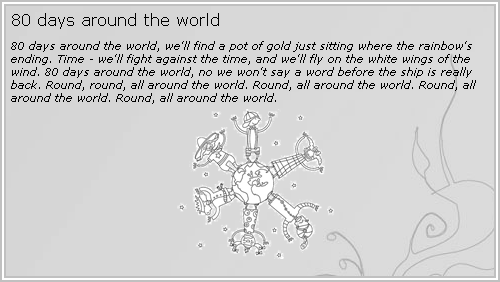
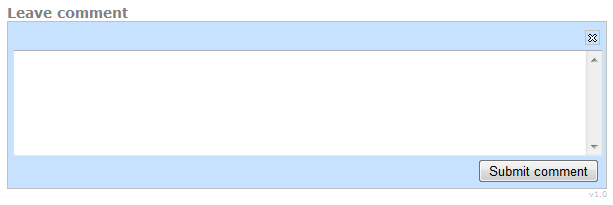
New comment – plain text:
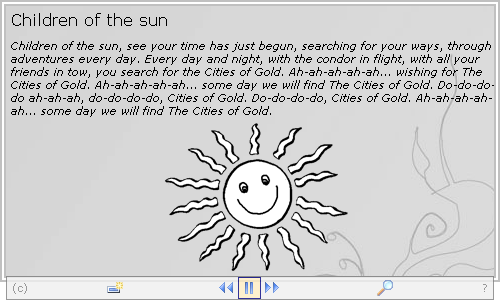
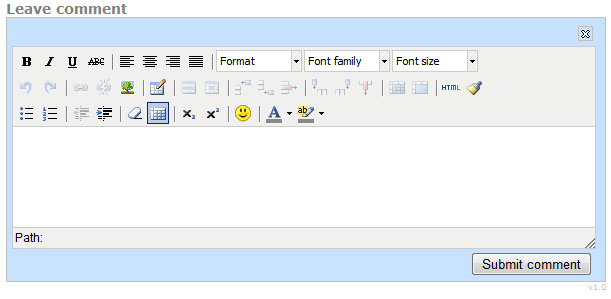
New comment – Rich text:
List of features
- Supports both SharePoint 2007 and SharePoint 2010
- Tested in IE7, IE9, Safari 5.0.5 for Windows, Firefox 5.0 and Google Chrome 12.0.742.112
- Multi level comments
- You can collapse top level threads
- Rich text or plain text comments
- Option to allow the authors to edit their comments
- Option to let specific users act as “moderators”
- Can be used in multiple locations within the site as each instance is identified by the relative URL of the page
- Simple “drop in CEWP-setup”
- On list holds all comments for all instances within the site
- This list that holds the comments is automatically created
- Layout customizable trough separate css-file
- And more…
How to use
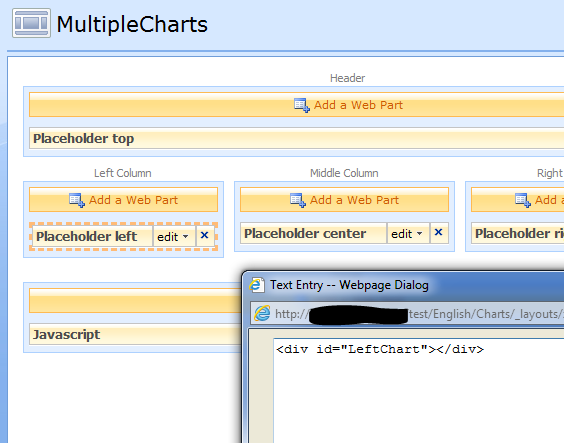
This solution is designed to be put in a CEWP where you want to use it. You will have to download all the files from the download section to a local folder/library where all users have read access, and change the <script src=”… in the CEWP code to reflect your local path.
CEWP code example
<div id="myCommentBox"></div>
<link rel="stylesheet" href="/test/EMSKJS/CommentBox/CommentBox.css">
<script type="text/javascript" src="/test/EMSKJS/CommentBox/jquery-1.6.2.min.js"></script>
<script type="text/javascript" src="/test/EMSKJS/CommentBox/CommentBox.js"></script>
<script type="text/javascript" src="/test/EMSKJS/CommentBox/spjs-webservices.js"></script>
<script type="text/javascript" src="/test/EMSKJS/CommentBox/tiny_mce/tiny_mce.js"></script>
<script type="text/javascript">

var pageID = location.pathname+"?ID="+GetUrlKeyValue('ID');
var argObj = {pageID:pageID,
			 containerID:'myCommentBox',
			 containerWidth:600,
			 replyLevels:2,
			 threadInitiallyCollapsed:false,
			 commentIndent:40,
			 commentBoxHeight:100,
			 showProfileImage:true,
			 createdByPrefix:'Posted by ',
			 createdPrefix:' on ',
			 modifiedPrefix:'- Modified: ',
			 modifiedByPrefix:' by ',
			 showUserEmail:true,
			 authorCanEdit:true,
			 editText:'Edit',
			 commentBoxRTE:false,
			 expandThread:"<span title='Expand thread'><img style='vertical-align:text-bottom' src='/_layouts/images/tpmax2.gif'  border='0'> Expand</span>",
			 collapseThread:"<span title='Collapse thread'><img style='vertical-align:text-bottom' src='/_layouts/images/tpmin2.gif' border='0'> Collapse</span>",
			 newCommentText:['Leave comment','You must sign in to comment'],
			 replyText:['Reply','<span title="You must be signed in to leave replies">Sign in</span>'],
			 submitText:'Submit comment',
			 canceImgHover:"Cancel",
			 deleteThreadText:'Delete comment',
			 moderateText:'Moderate',
			 moderatorID:['15','27'],
			 loadLiveProfile:true,
		 	 paging:false,
			 topLevelCommentsLimit:25,
			 showMoreCommentsText:"More comments",
			 sortAscending:true,
			 commentFormVisible:true
			 };

init_getComments(argObj);
</script>
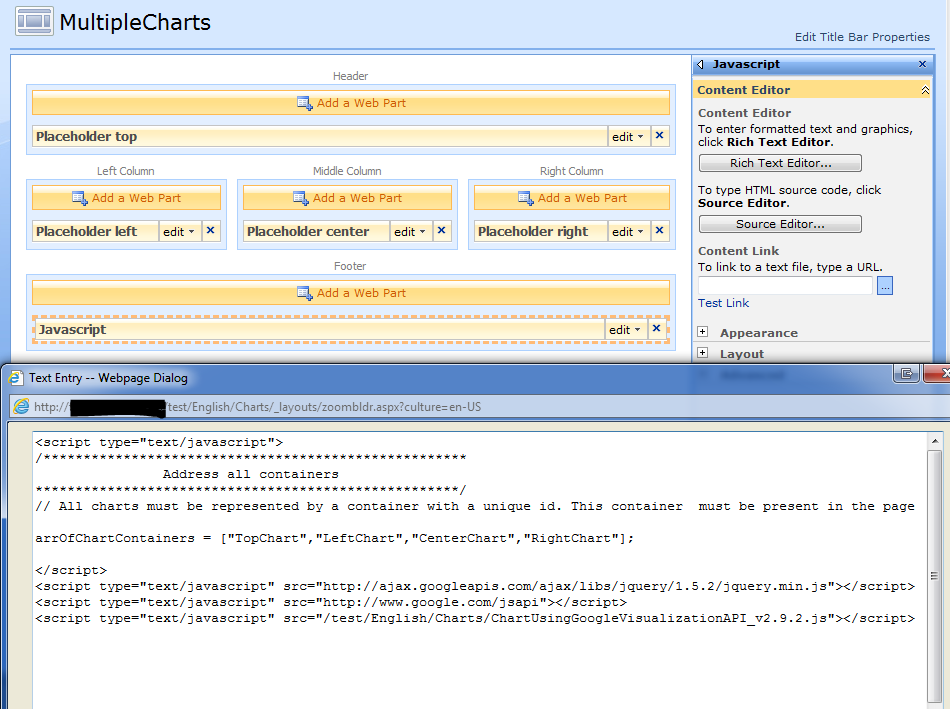
Note to SharePoint 2010 users:
Add this code to a text file and put it in a document library, then use the content link option on the CEWP to link to this code. This is necessary to overcome a “bug” in the CEWP handling when editing a SP2010 page. If you put a script that generates HTML directly into a CEWP, the HTML is accumulated when editing the page.
This tip is also recommended for SharePoint 2007 users, but is not absolutely necessary.
Argument object parameters
- pageID: The identifier for the unique instance – see separate description below.
- containerID: The container where the comments are inserted – see separate description below.
- containerWidth: Width in pixels.
- replyLevels: The number of nested levels.
- threadInitiallyCollapsed: true or false to indicate whether the threads are initially collapsed.
- commentIndent: The number of pixels to indent each nested level of comments.
- commentBoxHeight: The textbox (for new comments or reply) height in pixels.
- showProfileImage: true or false to indicate whether or not to display the profile image from the SharePoint user profile.
- createdByPrefix: The text before the user name of the author.
- createdPrefix: The text between the author name and the date/time for when the comment is created.
- modifiedPrefix: The text before the date/time for when the comment is modified.
- modifiedByPrefix: The text before the name of the editor.
- showUserEmail: true or false to indicate whether to show the email for the author.
- authorCanEdit: true or false to indicate whether the author can edit his or hers own comments.
- editText: The text on the “Edit item link”.
- commentBoxRTE: true or false to indicate whether to use the TinyMCE rich text editor – see separate description below.
- expandThread: The text/image of the “Expand thread” link.
- collapseThread: The text/image of the “Collapse thread” link.
- newCommentText: Array with the text on the “Leave comment” link for both authenticated and unauthenticated users.
- replyText: Array with the text on the “Reply” link for both authenticated and unauthenticated users.
- submitText: The text on the “Submit comment button”.
- canceImgHover: The mouseover text on the “Cancel comment image”
- deleteThreadText: The text on the “Delete comment” link.
- moderateText: The text on the “Moderate item link”.
- moderatorID: An array of the user ID’s (as string) for the moderators.
- loadLiveProfile: true or false to indicate whether to load the profile image and email from the user profile, or to use the values stored in the comment.
New in v1.2
- paging: Use this in conjunction with the next parameter to set the number of top level comments to display initially.
- topLevelCommentsLimit: The number of top level comments to display initially.
- showMoreCommentsText: If there are more comments, this text is used for the link to show the rest of the comments.
- sortAscending: true or false. Used to control the order of the comments.
- commentFormVisible: true or false. Used to have the comment box expanded or collapsed initially.
Details on “pageID”
For ordinary aspx-pages, use
location.pathname
When using in DispForm/EditForm, use
location.pathname+"?ID="+GetUrlKeyValue('ID')
Details on “containerID”
You can supply a placeholder in the page with the ID corresponding with the parameter “containerID” from the function call. You will want to do this to control the placement of the container, or to supply some custom settings (style or class). If you do not supply a container, it will be created automatically by the script.
Details on “commentBoxRTE”
TinyMCE – Javascript WYSIWYG Editor is a platform independent web based Javascript HTML WYSIWYG editor control released as Open Source under LGPL by Moxiecode Systems AB.
You can change the buttons and plugins for the TinyMCE by modifying the function “init_MCE” at the bottom of the file “CommentBox.js”. Refer the official site for details.
SharePoint 2010 users:
The TinyMCE solution has to be modified to change all “htm” files (and the references in the scripts) to “aspx” as the built in security feature in SharePoint 2010 does not let you open htm-files unless you change the “Browser file handling” from “Strict” to “Permissive”.
I have modified the files used in the default setup for the CommentBox solution. If you change the setup to include more plugins you must change the appropriate files. The modified package can be found in the download section.
Download
Please let me know if you find any bugs.
Alexander
If you use this solution, please consider donating a few dollars to keep me motivated.