25.08.2010 You find a new version of this feature here
24.05.2010 The code for the file “ChartUsingGoogleVisualizationAPI.js” is updated. Modified the array of fields to use for chart label and value columns. The two now uses the same array: ‘Number’, ‘Currency’, ‘Text’, ‘Calculated’, ‘Boolean’ ,’User’ ,’DateTime’ ,’Choice’ ,’Lookup’.
The version number is now set to 1.0.
21.05.2010 Added support for Lookup column as “Chart value column”. The code for the file “ChartUsingGoogleVisualizationAPI.js” is updated.
12.05.2010 Added support for Lookup column as “Chart label column”. The code for the file “ChartUsingGoogleVisualizationAPI.js” is updated.
11.05.2010 Added some examples at the bottom of the article.
08.05.2010 Updated to fix some bugs:
- Added support for “Currency”.
- Fixed this issue noticed by Charlie.: Each time I edit the CEWP/Chart, the “Chart label column” field returns to the top-most selection.
An example on Custom CAML is added (see image below).
The code for the file “ChartUsingGoogleVisualizationAPI.js” is updated.
This is a solution for creating charts directly from SharePoint lists using Google Visualization API. The solution is a CEWP-solution and requiring no other than a few script references. All code and data are processed and rendered in the browser. No data is sent to any server.
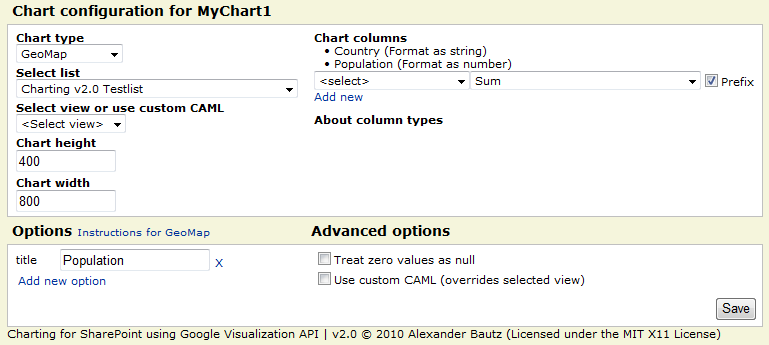
The solution features “Sum”, “Count” and “Average”, and can pull data from any column type, including calculated columns. The chart config is stored in a separate “chart config list”, but all the configuration is done in the GUI seen in the bottom picture.
You can pull data from any existing list view (even from personal views – for personal use), or using a custom CAML-query. If you use a custom query, you have the ability to filter the data source using a user profile property pulled from the user profile of the logged in user.
You may use a regular expression to separate out the part of the profile property to use:

An example on Custom CAML:

A few pictures to look at while you wait for the code:
Multiple charts setup in the same CEWP

The same page in “Edit page mode”:

The code
As always we start like this:
Create a document library to hold your scripts (or a folder on the root created in SharePoint Designer). In this example i have made a document library with a relative URL of “/test/English/Javascript” (a sub site named “test” with a sub site named “English” with a document library named “Javascript”):

The jQuery-library is found here. The pictures and the sourcecode refers to jquery-1.4.2.min. If you use another version, please update the reference in the code.
The scripts “interaction.js” and “stringBuffer.js” is created by Erucy and published on CodePlex.
Create a list to hold the configuration with these fields:
- Title (the standard title field already in the list)
- ChartConfig (Multiple lines of plain text)
- LabelCol (Single line of text)
- NumCols (Multiple lines of plain text)
- UseCustomCAML (Yes/No check box)
- CustomQuery (Multiple lines of plain text)
- ViewGuid (Single line of text)
- ListGuid (Single line of text)
- ChartHeight (Single line of text)
- ChartWidth (Single line of text)
- ChartType (Single line of text)
- GetFilterFromProfile (Yes/No check box)
- UserProfileProperty (Single line of text)
- RegexProfileProperty (Single line of text)
Note: These are FieldInternalNames and must be exactly like the above fields.
The GUID for this configuration list is used in the CEWP code below. Read here how to get the GUID for a list.
Add this code to a CEWP and place it in the page where you want the chart to appear:
<!-- Chart goes in this container -->
<div id="DemoChart1"></div>

<script type="text/javascript" src="http://www.google.com/jsapi"></script>
<script type="text/javascript" src="/test/English/Javascript/jquery-1.4.2.min.js"></script>
<script type="text/javascript" src="/test/English/Javascript/interaction.js"></script>
<script type="text/javascript" src="/test/English/Javascript/stringBuffer.js"></script>
<script type="text/javascript" src="/test/English/Javascript/ChartUsingGoogleVisualizationAPI.js"></script>
<script type="text/javascript">
/*****************************************************
			Set list Guids and parameters
*****************************************************/
// List name or Guid of the config list. This list must reside in the same site as the charts are to be displayed
chartConfigListGuid = 'E7A71324-043F-49A0-95EF-1E3E51DD8A85';
// The "People and Groups" list - must be set to support filtering by user profile data.
userListGuid = "{570D772F-0EAB-45A8-8C54-9CCD4EC6A0AF}";
// Modify if the site collection is on a managed path
userListBaseUrl = '';
// Each chart must be represented by a container with a unique id. This container  must be present in the page
arrOfChartContainers = ['DemoChart1'];

/*****************************************************
			Init charts
*****************************************************/
// Load the visualizations from Google
google.load("visualization","1",{packages:["columnchart","barchart","areachart","linechart","piechart","OrgChart"]});
google.setOnLoadCallback(onloadInitChart);
// Call the script when the visualization packages are loaded
function onloadInitChart(){
	call_drawChart(arrOfChartContainers);
}
</script>
The list item in the configuration list is automatically created when you call the script using a “chartID” not already found in the configuration list:

A “chartID” can be “reused” if you want the same chart to appear in multiple pages. The chart configuration list is not suppoosed to be “hand edited”, all configuration are done trough the UI in “Edit page mode”. There i however nothing that stops you from hand editing the configuration if you like.
When adding a new chartID, you get an empty chart:

Edit page to access the configuration:

The code for the file “ChartUsingGoogleVisualizationAPI.js”:
/* Charting for SharePoint using Google Visualization API
* ---------------------------------------------
* Created by Alexander Bautz
* alexander.bautz@gmail.com
* https://spjsblog.com
* Copyright (c) 2009-2010 Alexander Bautz (Licensed under the MIT X11 License)
* v1.0
* LastMod: 24.05.2010
* LastChange: Modified the array of fields to use for chart label and value columns. The two now uses the same array:
'Number', 'Currency', 'Text', 'Calculated', 'Boolean' ,'User' ,'DateTime' ,'Choice' ,'Lookup'
* ---------------------------------------------
* Include reference to:
* jquery - http://jquery.com
* interaction.js - http://spjslib.codeplex.com/
* stringBuffer.js - http://spjslib.codeplex.com/
* http://www.google.com/jsapi
* ChartUsingGoogleVisualizationAPI.js (this file)
* ---------------------------------------------
*/
function call_drawChart(arrOfChartContainerIDs){
$.each(arrOfChartContainerIDs,function(i,chartContainerID){
init_drawChart(chartContainerID);
});
}
function init_drawChart(cId){
// Check if container is defined
if($("#"+cId).length==0){
alert("The container with id "+cId+", is not defined!");
return;
}
$("#"+cId).before("<div id='"+cId+"_chartConfig' style='padding:10px;border:1px silver solid;background-color:#F5F5DC;display:none'></div>");
wsBaseUrl = L_Menu_BaseUrl + '/_vti_bin/';
var query = "<Where><Eq><FieldRef Name='Title' /><Value Type='Text'>"+cId+"</Value></Eq></Where>";
chartConfig = queryItems(chartConfigListGuid,query,
['ID',
'Title',
'ChartConfig',
'LabelCol',
'NumCols',
'UseCustomCAML',
'CustomQuery',
'GetFilterFromProfile',
'UserProfileProperty',
'RegexProfileProperty',
'ListGuid',
'ViewGuid',
'ChartHeight',
'ChartWidth',
'ChartType'],1);
if(chartConfig.count==0){
addChartId = addItem(chartConfigListGuid,{'Title':cId,'ChartHeight':'250','ChartWidth':'500','ChartConfig':'title:Add chart title here'});
if(!addChartId.success){
alert("An error occured while creating the configuration container:n"+addChartId.errorText);
}else{
var myChartConfig = {
myChartId:cId,
chartConfigID:addChartId.id,
configRaw:'title:Add chart title here',
useCustomCAML:false,
useUserProfileProperty:false,
userProfileProperty:'',
regexProfileProperty:'',
customCAML:'',
listGuid:'',
viewGuid:'',
labelCol:'',
numCols:'',
chartHeight:'200',
chartWidth:'450',
chartType:'ColumnChart'}
}
}else{
thisChartConfig = chartConfig.items[0];
var myChartConfig = {
myChartId:cId,
chartConfigID:thisChartConfig['ID'],
configRaw:(thisChartConfig['ChartConfig']!=null)?thisChartConfig['ChartConfig']:'',
useCustomCAML:(thisChartConfig['UseCustomCAML']==1)?true:false,
useUserProfileProperty:(thisChartConfig['GetFilterFromProfile']==1)?true:false,
userProfileProperty:(thisChartConfig['UserProfileProperty']!=null)?thisChartConfig['UserProfileProperty']:'',
regexProfileProperty:(thisChartConfig['RegexProfileProperty']!=null)?thisChartConfig['RegexProfileProperty']:'',
customCAML:(thisChartConfig['CustomQuery']!=null)?thisChartConfig['CustomQuery']:'',
listGuid:(thisChartConfig['ListGuid']!=null)?thisChartConfig['ListGuid']:'',
viewGuid:(thisChartConfig['ViewGuid']!=null)?thisChartConfig['ViewGuid']:'',
labelCol:(thisChartConfig['LabelCol']!=null)?thisChartConfig['LabelCol']:'',
numCols:(thisChartConfig['NumCols']!=null)?thisChartConfig['NumCols']:'',
chartHeight:(thisChartConfig['ChartHeight']!=null)?thisChartConfig['ChartHeight']:'200',
chartWidth:(thisChartConfig['ChartWidth']!=null)?thisChartConfig['ChartWidth']:'450',
chartType:(thisChartConfig['ChartType']!=null)?thisChartConfig['ChartType']:'ColumnChart'}
}
// Code inactive in "edit page mode"
if($(".ms-WPAddButton").length>0){
editChartConfig(myChartConfig);
}else{
// build chart option object
chartOptions = {};
if(arrConfig!=''){
var arrConfig = myChartConfig.configRaw.split(';');
$.each(arrConfig,function(i,optRaw){
var split = optRaw.split(':');
if(split.length==2){
var param = split[0];
var val = split[1];
}else{
var param = optRaw.substring(0,optRaw.indexOf(':'));
var val = optRaw.substring(optRaw.indexOf(':')+1);
}
if(param=='colors'){
var colorArr = [];
if(val.indexOf('color')>-1 && val.indexOf('darker')>-1){
var colorArrRaw = val.match(/{color:.*?}/g);
$.each(colorArrRaw,function(i,colorRaw){
var colorSplit = colorRaw.replace(/{|}|"|'/g,'').split(',');
var color = colorSplit[0].split(':')[1];
var darker = colorSplit[1].split(':')[1];
obj = {color:$.trim(color),darker:$.trim(darker)};
colorArr.push(obj);
});
}else{
var colorArrRaw = val.replace(/[|]|"|'/g,'').split(',');
$.each(colorArrRaw,function(i,color){
colorArr.push(color);
});
}
val = colorArr;
}
chartOptions[param]=val;
});
}
// Width and height
chartOptions.height=myChartConfig.chartHeight;
chartOptions.width=myChartConfig.chartWidth;
// labelCol
if(myChartConfig.labelCol!=''){
myChartConfig.labelCol = myChartConfig.labelCol.split(':')[0];
}
// NumCol
numColNameLabelAndType = [];
if(myChartConfig.numCols!=''){
var arrNumFields = myChartConfig.numCols.split(';');
$.each(arrNumFields,function(i,fieldOpt){
if(fieldOpt.length==0)return;
var full = fieldOpt.split(',');
numFieldObj = {};
$.each(full,function(i,paramRaw){
var split = paramRaw.split(':');
var param = split[0];
var val = split[1];
numFieldObj[param]=val;
});
numColNameLabelAndType.push(numFieldObj);
});
}
// Call chartBuilsing function
drawChart(myChartConfig,numColNameLabelAndType,chartOptions);
}
}
/*****************************************************
Get views
*****************************************************/
function getViewsForThisList(obj,lGuid,vGuid){
var onLoad = true;
if(typeof(obj)=='object'){
onLoad = false;
var listGuid = obj.find('option:selected').val();
var chartID = obj.attr('chartID');
}else{
var listGuid = lGuid;
}
if(listGuid!=''){
var viewColl = customGetViewCollection(listGuid);
var options = "<option value=''>&lt;Select view&gt;</option>";
$.each(viewColl.views,function(){
var personalView = '';
var personalViewTooltip = '';
if($(this).attr('Personal')=='TRUE'){
var personalView = " (Personal view)";
var personalViewTooltip = "If you create a chart from a personal view, the chart will only be available for you. Other users accessing the chart will receive a "No Data" message.";
}
if($(this).attr('Name')==vGuid){
selected = "selected='selected'";
}else{
selected = '';
}
options+="<option title='"+personalViewTooltip+"' value='"+$(this).attr('Name')+"' "+selected+">"+$(this).attr('DisplayName')+personalView+"</option>";
});
// Load eller select
if(onLoad){
return options;
}else{
$("#"+chartID+"_viewGuid").html(options);
//customGetListFields(listGuid,false);
fieldsOnloadOrOnchange('',listGuid,chartID);
}
}else{
// Load or select
if(onLoad){
alert("ListGuid not defined");
return '';
}else{
$("#"+chartID+"_viewGuid").html('');
$("#"+chartID+"_labelFieldsDiv").html('');
$("#"+chartID+"_numFieldsDiv").parents('td:first').find('select').each(function(){
$(this).remove();
});
$("#"+chartID+"_numFieldsDiv").html('');
$("#"+chartID+"_cloneNumSelectLink").hide();
}
}
}
function customCloneFieldSelector(chartID){
var td = $("#"+chartID+"_numColTd");
var clone = td.find('select:last').parent().clone();
clone.find('option:first').attr('selected',true);
td.append("<div>"+clone.html()+"</div>");
}
/*****************************************************
Save config
*****************************************************/
function saveChartConfig(obj,chartId,chartConfigId){
chartConfigData = [];
var configDiv = obj.parents("div[id='"+chartId+"_chartConfig']");
// Current options
configDiv.find("input[fin='ChartConfig']").each(function(){
chartConfigData.push($(this).attr('optionName')+":"+$(this).val());
});
// New options
configDiv.find("div.newChartConfigDiv").each(function(){
var newOptionName = $(this).find('input:first').val();
var newOptionVal = $(this).find('input:last').val();
if(newOptionName!=''&&newOptionVal!=''){
chartConfigData.push(newOptionName+":"+newOptionVal);
}
});
useCustomCAML = (configDiv.find("input[id='"+chartId+"_UseCustomCAML']").attr('checked')==true)?'1':'0';
useUserProfileProperty = (configDiv.find("input[id='"+chartId+"_GetFilterFromUserProfile']").attr('checked')==true)?'1':'0';
userProfileProperty = configDiv.find("select[id='"+chartId+"_selectUserprofileProperty'] option:selected").val();
regexProfileProperty= configDiv.find("input[id='"+chartId+"_RegexProfileProperty']").val();
customQueryData = $.trim(configDiv.find("textarea[id='"+chartId+"_customQuery']").val());
listGuidVal = $.trim(configDiv.find("select[id='"+chartId+"_listGuid'] option:selected").val());
viewGuidVal = $.trim(configDiv.find("select[id='"+chartId+"_viewGuid'] option:selected").val());
var labelSelect = $("#"+chartId+"_labelFieldsDiv").find('select option:selected');
labelCol = labelSelect.val()+":"+labelSelect.text();
numCols = '';
$("#"+chartId+"_numColTd").find('span').each(function(){
if($(this).attr('fin')!=undefined){
numCols += "label:"+$(this).attr('value')+",fin:"+$(this).attr('fin')+",action:"+$(this).attr('action')+",prefix:"+$(this).attr('prefix')+",fieldType:"+$(this).attr('fieldType')+";";
}
});
$("#"+chartId+"_numColTd").find('select.numFieldSelect').each(function(){
var thisOpt = $(this).find('option:selected');
if(thisOpt.val()!=''){
var fieldAction = $(this).next().find('option:selected').val();
var prefix = $(this).next().next().attr('checked');
numCols += "label:"+thisOpt.text()+",fin:"+thisOpt.val()+",action:"+fieldAction+",prefix:"+prefix+",fieldType:"+thisOpt.attr('fieldType')+";";
}
});
chartHeight = $.trim(configDiv.find("input[id='"+chartId+"_ChartHeight']").val());
chartWidth = $.trim(configDiv.find("input[id='"+chartId+"_ChartWidth']").val());
chartType = configDiv.find("select[id='"+chartId+"_selectChartType'] option:selected").val();
wsBaseUrl = L_Menu_BaseUrl + '/_vti_bin/';
res = updateItem(chartConfigListGuid,chartConfigId,
{'ChartConfig':chartConfigData.join(';'),
'UseCustomCAML':useCustomCAML,
'GetFilterFromProfile':useUserProfileProperty,
'UserProfileProperty':userProfileProperty,
'RegexProfileProperty':regexProfileProperty,
'CustomQuery':customQueryData,
'ListGuid':listGuidVal,
'ViewGuid':viewGuidVal,
'LabelCol':labelCol,
'NumCols':numCols,
'ChartHeight':chartHeight,
'ChartWidth':chartWidth,
'ChartType':chartType});
if(!res.success){
alert("Update chart config error:n"+res.errorText);
}else{
if(confirm("Saved OKnnRefresh page?"))location.href=location.href;
}
}
/*****************************************************
Test regular expression
*****************************************************/
function testRegExp(id){
var testRegExp = $("#"+id+"_RegexProfileProperty").val();
var profileProperty = $("#"+id+"_selectUserprofileProperty").val();
var up = getUserInfo();
if(up[profileProperty]!=''){
try
{
var regexResult = up[profileProperty].match(testRegExp);
msgBuffer = ["The full text in the user property field ""+profileProperty+"" for the user ""+up.Title+"" is:n"];
msgBuffer.push(up[profileProperty]);
msgBuffer.push("nnThe full RegExp match is this:n"+regexResult);
msgBuffer.push("nnThe part that will be used as a filter is this:n"+regexResult[1]);
var msg = msgBuffer.join('');
}catch(err){
var msg = err.description;
}
}else{
var msg = "The property field ""+profileProperty+"" is empty!";
}
alert(msg);
}
/*****************************************************
Chart config options link
*****************************************************/
function setLinkToConfigurationOptions(obj,chartType,chartId){
var link = [];
var onLoad = true;
if(typeof(obj)=='object'){
var chartId = obj.attr('chartID');
var selectedChartOption = obj.find('option:selected');
var chartType = selectedChartOption.val();
var chartTypeFriendly = selectedChartOption.text();
}else{
var selectedChartOption = $("#"+chartId+"_selectChartType").find('option:selected');
var chartType = selectedChartOption.val();
var chartTypeFriendly = selectedChartOption.text();
}
link.push("<a title='Opens in new window' href='http://code.google.com/intl/en-EN/apis/visualization/documentation/gallery/");
link.push(chartType.toLowerCase()+".html#Configuration_Options' target='_blank'>Instructions for "+chartTypeFriendly+"</a>");
link = link.join('');
// Write to placeholder
$("#"+chartId+"_chartOptionsLink").html("<div style='font-size:10px;font-weight:normal;display:inline'>"+link+"</div>");
}
/*****************************************************
Edit chart config
*****************************************************/
function editChartConfig(config){
var editOptLeftColArr = [];
var editOptRightColArr = [];
var editOptBottomArr = [];
var editOptTopColArr = [];
var editOptTopLeftColArr = [];
var editOptTopRightColArr = [];
var arrOfChartTypes = ['BarChart|Bar Chart','ColumnChart|Column Chart','AreaChart|Area Chart','LineChart|Line Chart',"PieChart|Pie Chart","OrgChart|Org Chart"];
var strChartTypeOptions = [];
// Chart types
$.each(arrOfChartTypes,function(i,typeRaw){
var split = typeRaw.split('|');
var cType = split[0];
var cTypeFriendly = split[1];
if(config.chartType==cType){
strChartTypeOptions.push("<option value='"+cType+"' selected>"+cTypeFriendly+"</option>");
}else{
strChartTypeOptions.push("<option value='"+cType+"'>"+cTypeFriendly+"</option>");
}
});
strChartTypeOptions= strChartTypeOptions.join('');
// ChartType
var strArr = [];
strArr.push("<tr>");
strArr.push("<td colspan='2' style='padding:3 5 0 5'><label style='font-weight:bold'>Chart type</label><br />");
strArr.push("<select id='"+config.myChartId+"_selectChartType' chartID='"+config.myChartId+"' onchange='javascript:setLinkToConfigurationOptions($(this))'>");
strArr.push(strChartTypeOptions);
strArr.push("</selec>");
strArr.push("</td></tr>");
// ListGuid
views = "<option value='' selected>Select list first</option>";
var listColl = customGetListCollection();
var listOptionsStrBuffer = ["<option value=''>&lt;Select list&gt;</option>"];
$.each(listColl.lists,function(){
if($(this).attr('Name')==config.listGuid){
views = getViewsForThisList('',config.listGuid,config.viewGuid);
selected = "selected='selected'";
}else{
selected = '';
}
listOptionsStrBuffer.push("<option value='"+$(this).attr('Name')+"' "+selected+">"+$(this).attr('Title')+"</option>");
});
listSelect = "<select id='"+config.myChartId+"_listGuid' chartID='"+config.myChartId+"' onchange='javascript:getViewsForThisList($(this),""+config.listGuid+"",""+config.viewGuid+"")'>"+listOptionsStrBuffer.join('')+"</select>";
strArr.push("<tr>");
strArr.push("<td colspan='2' style='padding:3 5 0 5'><label style='font-weight:bold'>Select list</label><br />");
strArr.push(listSelect);
strArr.push("</td></tr>");
// ViewGuid
strArr.push("<tr>");
strArr.push("<td colspan='2' style='padding:3 5 0 5'><label style='font-weight:bold'>Select view or use custom CAML</label><br />");
strArr.push("</td></tr><tr><td colspan='2' style='padding:0 5 0 5'><select id='"+config.myChartId+"_viewGuid' chartID='"+config.myChartId+"'>");
strArr.push(views);
strArr.push("</select>");
strArr.push("</td></tr>");
// Width and height
strArr.push("<tr>");
strArr.push("<td colspan='2' style='padding:3 5 0 5'><label style='font-weight:bold'>Chart height</label><br />");
strArr.push("<input style='width:100px' id='"+config.myChartId+"_ChartHeight' value='"+config.chartHeight+"' />");
strArr.push("</td></tr>");
strArr.push("<tr>");
strArr.push("<td colspan='2' style='padding:3 5 0 5'><label style='font-weight:bold'>Chart width</label><br />");
strArr.push("<input style='width:100px' id='"+config.myChartId+"_ChartWidth' value='"+config.chartWidth+"' />");
strArr.push("</td></tr>");
str = strArr.join('');
editOptTopLeftColArr.push(str);
// Fields
var strArr = [];
strArr.push("<tr>");
strArr.push("<td colspan='2' style='padding:3 5 0 5'><label style='font-weight:bold'>Chart label column</label><br />");
strArr.push("<div id='"+config.myChartId+"_labelFieldsDiv'></div>");
strArr.push("</td></tr>");
strArr.push("<tr><td colspan='2' style='padding:3 5 0 5'><label style='font-weight:bold'>Chart value columns</label></td></tr>");
strArr.push("<tr><td colspan='2' id='"+config.myChartId+"_numColTd' style='padding:0 5 0 5'><div id='"+config.myChartId+"_numFieldsDiv'></div></td></tr>");
strArr.push("<tr><td colspan='2' style='padding:0 5 0 5'><a id='"+config.myChartId+"_cloneNumSelectLink' chartID='"+config.myChartId+"' style='display:none' href='javascript:customCloneFieldSelector(""+config.myChartId+"")'>Add new</a></td></tr>");
strArr.push("<tr><td colspan='2' style='padding:10 5 0 5'><div title='Click to read about column types' style='cursor:pointer;font-weight:bold' onclick='$(this).next().toggle()'>About column types</div>");
strArr.push("<div style='display:none;width:350px'>");
strArr.push("<div style='padding:3px;border:1px silver solid'>Columns containing numbers can be summed. The column can contain text and number mixed. ");
strArr.push("A Regular expression extracts the number from the text.<br /><br />");
strArr.push("However notice that only the first occurance of a int/float is used.<br /><br />");
strArr.push("Boolean columns can be counted or summed (Yes=1, No=0).<br /><br />");
strArr.push("All columns can be counted (not empty=1, empty=0)</div></div></td></tr>")
strArr.push("</td></tr>");
str = strArr.join('');
editOptTopRightColArr.push(str);
// Options
if(config.configRaw!=''){
var arrConfigData = config.configRaw.split(';');
$.each(arrConfigData,function(i,rawOption){
split = rawOption.split(':');
if(split.length==2){
var label = split[0];
var val = split[1].replace(/'/g,'"');
}else{
var label = rawOption.substring(0,rawOption.indexOf(':'));
var val = rawOption.substring(rawOption.indexOf(':')+1).replace(/'/g,'"');
}
var strArr = [];
strArr.push("<tr>");
strArr.push("<td style='padding:0 5 0 5'>"+label+"</td>");
strArr.push("<td style='padding:0 5 0 5'><input style='width:150px' ");
strArr.push("fin='ChartConfig' optionName='"+label+"' id='"+config.myChartId+"_"+label+"' type='Text' value='"+val+"' />");
strArr.push("<a title='Remove current option' style='padding-left:5px' href='javascript:' onclick='addOrRemove($(this),false)'>X</a>");
strArr.push("</td></tr>");
str = strArr.join('');
editOptLeftColArr.push(str);
});
}
// Add new option
var strArr = [];
strArr.push("<tr>");
strArr.push("<td colspan='2' style=''>");
strArr.push("<a style='padding-left:5px' href='javascript:' onclick='addOrRemove($(this),true)'>Add new option</a>");
strArr.push("</td></tr>");
str = strArr.join('');
editOptLeftColArr.push(str);
// CAML
var customCAMLchecked = '';
var customCAMLAreaDisplay = 'none'
if(config.useCustomCAML){
customCAMLchecked = 'checked';
customCAMLAreaDisplay = 'block';
}
var filterFromUPchecked = '';
var filterFromUPdisplay = 'none';
if(config.useUserProfileProperty){
filterFromUPchecked = 'checked';
var filterFromUPdisplay = 'block';
}
var strArr = [];
strArr.push("<tr>");
strArr.push("<td colspan='2' style='padding:0 5 0 5'>");
strArr.push("<input type='checkbox' id='"+config.myChartId+"_UseCustomCAML' "+customCAMLchecked+" onclick='javascript:$("#"+config.myChartId+"_tableUseCustomCAML").toggle()'><label for='"+config.myChartId+"_UseCustomCAML'>Use custom CAML (overrides selected view)</label>");
strArr.push("</td></tr>");
strArr.push("<tr><td id='"+config.myChartId+"_tableUseCustomCAML' style='display:"+customCAMLAreaDisplay+"'>");
strArr.push("<table><tr><td>");
strArr.push("<input type='checkbox' id='"+config.myChartId+"_GetFilterFromUserProfile' "+filterFromUPchecked+" onclick='javascript:$("#"+config.myChartId+"_userProfilePropertyDescription").toggle()'><label for='"+config.myChartId+"_GetFilterFromUserProfile'>Get filter value from this profile property:&nbsp;</label>");
strArr.push("<select id='"+config.myChartId+"_selectUserprofileProperty' chartID='"+config.myChartId+"'>");
var arrOfUserProfileProperties = ['ID','Name','Title','EMail','Department','JobTitle','SipAddress'];
$.each(arrOfUserProfileProperties,function(i,prop){
var propSelected = '';
if(prop==config.userProfileProperty){
propSelected = 'selected';
}
strArr.push("<option value='"+prop+"' "+propSelected+">"+prop+"</option>");
});
strArr.push("</select>");
strArr.push("</td></tr>");
strArr.push("<tr><td colspan='2' style='padding:0 5 0 5'>");
strArr.push("<div id='"+config.myChartId+"_userProfilePropertyDescription' style='width:390px;display:"+filterFromUPdisplay+"'>");
strArr.push("<div style='color:red'>");
strArr.push("To use the user profile property as a filter, you must insert {} as a placeholder where the user profile property is to be inserted.<br /><br />");
strArr.push("If you use a regular expression to identify the value, it is the first backreference that is used.</div><br />");
strArr.push("<label>Optional RegEx to match property:&nbsp;</label><a href='javascript:testRegExp(""+config.myChartId+"")'>Test regular expression</a><br />");
strArr.push("<input id='"+config.myChartId+"_RegexProfileProperty' type='Text' value='"+config.regexProfileProperty+"' style='width:100%'></div>");
strArr.push("</td></tr>");
str = strArr.join('');
editOptRightColArr.push(str);
escapedCAML = config.customCAML.replace(/</g,'&lt;').replace(/>/g,'&gt;');
var strArr = [];
strArr.push("<tr>");
strArr.push("<td style='padding:0 5 0 5'><label>Custom CAML-query</label><br />");
strArr.push("<textarea style='width:400px;height:150px' id='"+config.myChartId+"_customQuery'>"+escapedCAML+"</textarea>");
strArr.push("</td></tr></table>");
strArr.push("</td></tr>");
str = strArr.join('');
editOptRightColArr.push(str);
// Save button
var strArr = [];
strArr.push("<tr>");
strArr.push("<td colspan='2' style='text-align:right'>");
strArr.push("<input onclick='javascript:saveChartConfig($(this),""+config.myChartId+"",""+config.chartConfigID+"");' type='button' value='Save' />");
strArr.push("</td></tr>");
str = strArr.join('');
editOptBottomArr.push(str);
// wrap up
var strArr = [];
strArr.push("<table style='background-color:#ffffff;width:100%' cellpadding='0' cellspacing='2'>");
strArr.push(editOptTopColArr.join(''));
strArr.push("</table>");
wrapTop = strArr.join('');
var strArr = [];
strArr.push("<table style='background-color:#ffffff;width:100%;' cellpadding='2' cellspacing='0'>");
strArr.push(editOptTopLeftColArr.join(''));
strArr.push("</table>");
wrapTopLeft = strArr.join('');
var strArr = [];
strArr.push("<table style='background-color:#ffffff;width:100%' cellpadding='2' cellspacing='0'>");
strArr.push(editOptTopRightColArr.join(''));
strArr.push("</table>");
wrapTopRight = strArr.join('');
var strArr = [];
strArr.push("<table style='background-color:#ffffff;width:100%;' cellpadding='2' cellspacing='0'>");
strArr.push(editOptLeftColArr.join(''));
strArr.push("</table>");
wrapBottomLeft = strArr.join('');
var strArr = [];
strArr.push("<table style='background-color:#ffffff;width:100%' cellpadding='2' cellspacing='0'>");
strArr.push(editOptRightColArr.join(''));
strArr.push("</table>");
wrapBottomRight = strArr.join('');
var strArr = [];
strArr.push("<table style='background-color:#ffffff;width:100%' cellpadding='2' cellspacing='0'>");
strArr.push(editOptBottomArr.join(''));
strArr.push("</table>");
wrapBottom = strArr.join('');
var wrap = [];
wrap.push("<table cellpadding='0' cellspacing='0'>");
wrap.push("<tr><td valign='top' colspan='2' style='padding:5px;font-size:14px;font-weight:bold;background-color:#F5F5DC'>Chart configuration for "+config.myChartId+"</td>");
wrap.push("<tr><td valign='top' colspan='2' style='border-left:1px silver solid;border-top:1px silver solid;border-right:1px silver solid'>"+wrapTop+"</td></tr>");
wrap.push("<tr><td valign='top' style='border-left:1px silver solid;border-bottom:1px silver solid;padding:3px'>"+wrapTopLeft+"</td>")
wrap.push("<td valign='top' style='border-right:1px silver solid;border-bottom:1px silver solid;padding:3px'>"+wrapTopRight+"</td></tr>");
wrap.push("<tr><td valign='top' style='padding:5px;font-size:14px;font-weight:bold;background-color:#F5F5DC'>Options&nbsp;<span id='"+config.myChartId+"_chartOptionsLink'></span></td>");
wrap.push("<td valign='top' style='padding:5px;font-size:14px;font-weight:bold;background-color:#F5F5DC'>Advanced options</td></tr>");
wrap.push("<tr><td valign='top' style='border-left:1px silver solid;border-top:1px silver solid;padding:3px'>"+wrapBottomLeft+"</td>");
wrap.push("<td valign='top' style='border-top:1px silver solid;border-right:1px silver solid;padding:3px'>"+wrapBottomRight+"</td></tr>");
wrap.push("<tr><td colspan='2' valign='top' style='border-left:1px silver solid;border-bottom:1px silver solid;border-right:1px silver solid;text-align:right;padding:3'>"+wrapBottom+"</td></tr></table>");
wrap = wrap.join('');
$("#"+config.myChartId+"_chartConfig").show().html(wrap);
// Fields
if(config.listGuid!=''){
fieldsOnloadOrOnchange(config);
}else{
$("#"+config.myChartId+"_labelFieldsDiv").html('Select list first');
$("#"+config.myChartId+"_numFieldsDiv").html('Select list first');
}
// Option link
var chartConfigLink = setLinkToConfigurationOptions('',config.chartType,config.myChartId);
}
function fieldsOnloadOrOnchange(config,listGuid,chartID){
if(typeof(config)=='object'){
var onLoad = true;
listGuid = config.listGuid;
}else{
var onLoad = false;
}
var fieldsObj = customGetListFields(listGuid,true);
var currNumFieldsStrBuffer = [];
var labelFieldSelectBuffer = [];
var numFieldSelectBuffer = ["<option value=''>&lt;select&gt;</option>"];
if(onLoad){
// Numcols
currNumFieldsArr = config.numCols.split(';');
$.each(currNumFieldsArr,function(i,rawVal){
var split = rawVal.split(',');
if(split.length>1){
var label = split[0].split(':')[1];
var fin = split[1].split(':')[1];
var action = split[2].split(':')[1];
var prefix = split[3].split(':')[1];
var fieldType = split[4].split(':')[1];
var actionLabel = " ("+action+")";
if(prefix!='true'){
var actionLabel = " ("+action+" no prefix)";
}
currNumFieldsStrBuffer.push("<span title='Click to remove' style='cursor:pointer;padding-left:10px;' ");
currNumFieldsStrBuffer.push("fin='"+fin+"' value='"+label+"' action='"+action+"' prefix='"+prefix+"' fieldType='"+fieldType+"' onclick='javascript:$(this).next().andSelf().remove()'>");
currNumFieldsStrBuffer.push("&bull;&nbsp;"+label+actionLabel+"</span><br />");
}
});
// Build the select for the "string" col
var labelColSplit = config.labelCol.split(':');
var strFin = labelColSplit[0];
var strLabel = labelColSplit[1];
}
// Build field selector
$.each(fieldsObj.labelFields,function(i,rawOpt){
var split = rawOpt.split('|');
var fin = split[0];
var disp = split[1];
var selected = '';
if(onLoad){
if(fin==strFin){
selected = "selected";
}
}
labelFieldSelectBuffer.push("<option value='"+fin+"' "+selected+">"+disp+"</option>");
});
$.each(fieldsObj.numFields,function(i,rawOpt){
var split = rawOpt.split('|');
var fin = split[0];
var disp = split[1];
var fieldType = split[2];
numFieldSelectBuffer.push("<option value='"+fin+"' fieldType='"+fieldType+"'>"+disp+"</option>");
});
numFieldsBuffer = [];
labelFields = "<div><select chartID='"+config.myChartId+"'>"+labelFieldSelectBuffer.join('')+"</select></div>";
if(fieldsObj.onLoad){
numFieldsBuffer.push(currNumFieldsStrBuffer.join(''));
}
numFieldsBuffer.push("<div><select class='numFieldSelect'>"+numFieldSelectBuffer.join('')+"</select>");
numFieldsBuffer.push("<select class='numActionSelect'>");
numFieldsBuffer.push("<option value='Sum' selected>Sum</option>");
numFieldsBuffer.push("<option value='Count'>Count</option>");
numFieldsBuffer.push("<option value='Average'>Average</option></select>");
numFieldsBuffer.push("<input title='Uncheck to remove the "Sum of", "Count of" or "Average of" prefix' type='checkbox' checked><label>Prefix</label></div>");
var numFields = numFieldsBuffer.join('');
// Load or select
if(onLoad){
$("#"+config.myChartId+"_labelFieldsDiv").html(labelFields);
$("#"+config.myChartId+"_numFieldsDiv").html(numFields);
$("#"+config.myChartId+"_cloneNumSelectLink").show();
}else if(!onLoad){
$("#"+chartID+"_labelFieldsDiv").html(labelFields);
$("#"+chartID+"_numFieldsDiv").parents('td:first').find('select').each(function(){
$(this).parent().remove();
});
$("#"+chartID+"_numFieldsDiv").html(numFields);
$("#"+chartID+"_cloneNumSelectLink").show();
}
}
/*****************************************************
Get fields
*****************************************************/
function customGetListFields(listName,onLoad){
xmlStr = [];
xmlStr.push('<GetList xmlns="http://schemas.microsoft.com/sharepoint/soap/">');
xmlStr.push('<listName>' + listName + '</listName>');
xmlStr.push('</GetList>');
xmlStr = xmlStr.join('');
var result = {success:false,labelFields:[],numFields:[]};
wrapSoapRequest(wsBaseUrl + 'lists.asmx', 'http://schemas.microsoft.com/sharepoint/soap/GetList', xmlStr, function(data){
if($('ErrorText', data).length > 0){
result.success = false;
}else{
result.onLoad = (onLoad==true)?true:false;
result.success = true;
result.name = $('List', data).attr('Name');
var arrOfTypesToIncludeInStr = ['Number','Currency','Text','Calculated','Boolean','User','DateTime','Choice','Lookup'];
var arrOfTypesToIncludeInNum = ['Number','Currency','Text','Calculated','Boolean','User','DateTime','Choice','Lookup'];
$('Field', data).each(function(){
if($(this).attr('DisplayName')!=undefined){
if($.inArray($(this).attr('Type'),arrOfTypesToIncludeInStr)>-1){
// Include user created single item lookup
if($(this).attr('Type')=='Lookup' && $(this).attr('FromBaseType')=='TRUE')return;
result.labelFields.push($(this).attr('Name')+"|"+$(this).attr('DisplayName'));
}
if($.inArray($(this).attr('Type'),arrOfTypesToIncludeInNum)>-1){
// Include user created single item lookup
if($(this).attr('Type')=='Lookup' && $(this).attr('FromBaseType')=='TRUE')return;
result.numFields.push($(this).attr('Name')+"|"+$(this).attr('DisplayName')+"|"+$(this).attr('Type'));
}
}
});
}
});
return result;
}
/*****************************************************
Get list collection
*****************************************************/
function customGetListCollection(){
xmlStr = '<GetListCollection xmlns="http://schemas.microsoft.com/sharepoint/soap/" />';
var result = {success:false, errorCode:'', errorText:'internal error', lists:[]};
wrapSoapRequest(L_Menu_BaseUrl + '/_vti_bin/lists.asmx', 'http://schemas.microsoft.com/sharepoint/soap/GetListCollection', xmlStr, function(data){
if ($('ErrorText', data).length > 0) {
result.success = false;
} else {
result.success = true;
var arrTypesToSkip = ['110','111','112','113','114','115','116','117','118'];
$('List', data).each(function(i){
if($.inArray($(this).attr('ServerTemplate'),arrTypesToSkip)==-1){
result.lists.push($(this));
}
});
}
});
return result;
}
/*****************************************************
Get view collection
*****************************************************/
function customGetViewCollection(listGuid){
xmlStr = "<GetViewCollection xmlns='http://schemas.microsoft.com/sharepoint/soap/'><listName>"+listGuid+"</listName></GetViewCollection>";
var result = {success:false, errorCode:'', errorText:'internal error', views:[]};
wrapSoapRequest(L_Menu_BaseUrl + '/_vti_bin/views.asmx', 'http://schemas.microsoft.com/sharepoint/soap/GetViewCollection', xmlStr, function(data){
if ($('ErrorText', data).length > 0) {
result.success = false;
} else {
result.success = true;
$('View', data).each(function(i){
if($(this).attr('Hidden')!='TRUE'){
result.views.push($(this));
}
});
}
});
return result;
}
/*****************************************************
Wrap webservice call
*****************************************************/
function wrapSoapRequest(webserviceUrl,requestHeader,soapBody,successFunc){
var xmlWrap = [];
xmlWrap.push("<?xml version='1.0' encoding='utf-8'?>");
xmlWrap.push("<soap:Envelope xmlns:xsi='http://www.w3.org/2001/XMLSchema-instance' xmlns:xsd='http://www.w3.org/2001/XMLSchema' xmlns:soap='http://schemas.xmlsoap.org/soap/envelope/'>");
xmlWrap.push("<soap:Body>");
xmlWrap.push(soapBody);
xmlWrap.push("</soap:Body>");
xmlWrap.push("</soap:Envelope>");
xmlWrap = xmlWrap.join('');
$.ajax({
async:false,
type:"POST",
url:webserviceUrl,
contentType:"text/xml; charset=utf-8",
processData:false,
data:xmlWrap,
dataType:"xml",
beforeSend:function(xhr){
xhr.setRequestHeader('SOAPAction',requestHeader);
},
success:successFunc,
error:function(xhr){
alert(xhr.statusText);
}
});
}
/*****************************************************
Add or remove chart config option
*****************************************************/
function addOrRemove(obj,add){
if(add){
var strArr = [];
strArr.push("<tr>");
strArr.push("<td style='padding:0 5 0 5'>Option name</td>");
strArr.push("<td style='padding:0 5 0 5'><div class='newChartConfigDiv'><input title='Option name' style='width:100px' id='NewOptionName' type='Text' />");
strArr.push("<label style='padding:0 5 0 5'>Value</label><input title='Option value' style='width:100px' id='NewOptionVal' type='Text' />");
strArr.push("<a title='Remove current option' style='padding-left:5px' href='javascript:' onclick='addOrRemove($(this),false)'>X</a></div>");
strArr.push("</td></tr>");
str = strArr.join('');
obj.parents('tr:first').before(str);
}else{
obj.parents('tr:first').remove();
}
}
/*****************************************************
Draw chart
*****************************************************/
chart = '';
function drawChart(config,numFieldsArrFromConfig,options) {
var data = new google.visualization.DataTable();
// String
data.addColumn('string',config.labelCol);
// Number
if(config.chartType=='OrgChart'){
var coltype = 'string';
}else{
var coltype = 'number';
}
$.each(numFieldsArrFromConfig,function(i,colObj){
var actionFriendlyName = '';
if(colObj.prefix=='true'){
switch(colObj.action){
case 'Sum':
var actionFriendlyName = 'Sum of ';
break;
case 'Count':
var actionFriendlyName = 'Count of ';
break;
case 'Average':
var actionFriendlyName = 'Average of ';
break;
default:
var actionFriendlyName = '';
}
}
data.addColumn(coltype,actionFriendlyName+colObj.label);
});
wsBaseUrl = L_Menu_BaseUrl + '/_vti_bin/';
viewFields = [config.labelCol];
$.each(numFieldsArrFromConfig,function(i,colObj){
viewFields.push(colObj.fin);
});
if(config.useCustomCAML){
var customCAML = config.customCAML;
if(config.useUserProfileProperty){
userInfoObj = getUserInfo();
var filterValue = userInfoObj[config.userProfileProperty];
if(config.regexProfileProperty!='' && filterValue!=''){
try
{
var regExpMatch = filterValue.match(config.regexProfileProperty)[1];
}
catch(err)
{
window.status="SharePoint Javascripts - Error in RegExp match in chart with ID ""+config.myChartId+"". The error was: "+err.description;
}
if(regExpMatch!=undefined){
filterValue=regExpMatch;
}
}
if(filterValue==''){
$("#"+config.myChartId).after("<div style='width:"+options.width+";padding-left:5px;font-size:8px'>The selected user profile property ("+config.userProfileProperty+") is empty!</div>");
}else{
$("#"+config.myChartId).after("<div style='width:"+options.width+";padding-left:5px;font-size:8px'>Filtered by user profile property "+config.userProfileProperty+"="+filterValue+"</div>");
}
customCAML = customCAML.replace(/{}/,filterValue);
}
res = queryItems(config.listGuid,customCAML,viewFields);
if(res.count==-1){
alert("An error occured in the "customCAML" for the chart: "+config.myChartId+".n"+
"Check list guid and CAML query:nn"+
"ListGuid:n"+config.listGuid+"nn"+
"CAML-query:n"+config.customCAML);
}
}else{
res = queryItemsByViewName(config.listGuid,config.viewGuid,viewFields);
}
dataObj = {};
var rowCount = 0;
$.each(res.items,function(i,item){
labelColVal = (item[config.labelCol]!=null)?item[config.labelCol]:'';
// Strip off any prefix
if(labelColVal!=null&&labelColVal.indexOf(';#')>-1){
labelColVal = labelColVal.substring(labelColVal.indexOf(';#')+2);
}
if(dataObj[labelColVal]==undefined){
dataObj[labelColVal]={};
rowCount ++;
}
if(config.chartType=='OrgChart'){
$.each(numFieldsArrFromConfig,function(idx,obj){
var thisVal = item[obj.fin];
// If the source is a calculated column
if(thisVal!=null&&thisVal.indexOf(';#')>-1){
thisVal = thisVal.match(/([d.]+$)/)[0];
}
// Build object
if(dataObj[labelColVal][obj.fin]==undefined){
var val = (thisVal!=null)?thisVal:null;
dataObj[labelColVal][obj.fin]=val;
}
});
}else{
$.each(numFieldsArrFromConfig,function(idx,obj){
var thisVal = item[obj.fin];
// If the source is a calculated column - find first number
if(thisVal!=null&&thisVal.indexOf(';#')>-1){
thisVal = thisVal.match(/[0-9.-]+/).toString();
}
// Build object
if(dataObj[labelColVal][obj.fin+obj.action]==undefined){
if(obj.action=='Sum'){
var val = (thisVal!=null)?parseFloat(thisVal.match(/[0-9.-]+/).toString()):null;
if(isNaN(val))val=null;
}else if(obj.action=='Count'){
if(obj.fieldType=='Boolean'){
var val = (thisVal==1)?1:0;
}else{
var val = (thisVal!=null)?1:0;
}
}else if(obj.action=='Average'){
var val = (thisVal!=null)?parseFloat(thisVal.match(/[0-9.-]+/).toString()):null;
if(isNaN(val))val=null;
}
dataObj[labelColVal][obj.fin+obj.action]={'value':val,'action':obj.action,'count':1};
}else{
if(obj.action=='Sum'){
var val = (thisVal!=null)?parseFloat(thisVal.match(/[0-9.-]+/).toString()):null;
if(isNaN(val))val=null;
}else if(obj.action=='Count'){
if(obj.fieldType=='Boolean'){
var val = (thisVal==1)?1:0;
}else{
var val = (thisVal!=null)?1:0;
}
}else if(obj.action=='Average'){
var val = (thisVal!=null)?parseFloat(thisVal.match(/[0-9.-]+/).toString()):null;
if(isNaN(val))val=null;
}
dataObj[labelColVal][obj.fin+obj.action]['value']+=val;
dataObj[labelColVal][obj.fin+obj.action]['count']+=1;
}
});
}
});
data.addRows(rowCount);
rowIndex=0;
if(config.chartType=='OrgChart'){
$.each(dataObj,function(propName,obj){
var descr = null;
// If the name is added with a comma and a description - like "Bruce Springsteen,Bruce Springsteen<br /><div style="text-align:center"><font color="red"><em>The Boss</em></font></div>"
var split = propName.split(',');
if(split.length>1){
propName=split[0];
descr=split[1];
}
data.setCell(rowIndex,0,propName,descr);
colIndex=1;
$.each(obj,function(idx,objVal){
data.setCell(rowIndex,colIndex,objVal);
colIndex++
});
rowIndex++
});
}else{
$.each(dataObj,function(propName,obj){
data.setValue(rowIndex,0,propName);
colIndex=1;
$.each(obj,function(idx,objVal){
if(objVal.action=='Average'){
val = objVal.value/objVal.count;
}else{
val = objVal.value;
}
var roundedVal = Math.round(val*100)/100;
data.setValue(rowIndex,colIndex,roundedVal);
colIndex++
});
rowIndex++
});
}
// Draw chart
chart = new google.visualization[config.chartType](document.getElementById(config.myChartId));
chart.draw(data,options);
// Add mouse over
google.visualization.events.addListener(chart,'onmouseover',chartMouseOver);
google.visualization.events.addListener(chart,'onmouseout',chartMouseOut);
}
function chartMouseOver(e){
this.setSelection([e]);
}
function chartMouseOut(e){
this.setSelection([{'row': null, 'column': null}]);
}
/*****************************************************
Web service calls
*****************************************************/
function queryItemsByViewName(listName, viewName, viewFields, pagingInfo){
var content = buildQueryContentByViewName(listName, viewName, viewFields, pagingInfo);
var result = {count:-1, nextPagingInfo:'', items:new Array()};
innerPost(wsBaseUrl + 'lists.asmx', 'http://schemas.microsoft.com/sharepoint/soap/GetListItems', content, function(data){
result.count = $('rs\:data', data).attr('ItemCount');
result.nextPagingInfo = $('rs\:data', data).attr('ListItemCollectionPositionNext');
$('z\:row', data).each(function(idx, itemData){
result.items.push(generateItem(itemData, viewFields));
});
});
return result;
}
function buildQueryContentByViewName(listName, viewName, viewFields, pagingInfo){
var result = new StringBuffer();
result.append('<GetListItems xmlns="http://schemas.microsoft.com/sharepoint/soap/">');
result.append('<listName>' + listName + '</listName>');
result.append('<viewName>' + viewName + '</viewName>');
if(viewFields != null && viewFields.length > 0){
result.append('<viewFields><ViewFields xmlns="">');
$.each(viewFields, function(idx, field){
result.append('<FieldRef Name="' + field + '"/>');
});
result.append('</ViewFields></viewFields>');
}
result.append('<queryOptions><QueryOptions xmlns=""><IncludeMandatoryColumns>FALSE</IncludeMandatoryColumns>');
if(pagingInfo != undefined && pagingInfo != null && pagingInfo != '')
result.append('<Paging ListItemCollectionPositionNext="' + pagingInfo.replace(/&/g, '&amp;') + '" />');
result.append('</QueryOptions></queryOptions>');
result.append('</GetListItems>');
return result.toString();
}
/*****************************************************
Access user infor for filtering chart data
*****************************************************/
function getUserInfo(UserId){
wsBaseUrl = userListBaseUrl + '/_vti_bin/';
var uiObj = {};
if(typeof(UserId)=="undefined" || UserId=='')UserId = _spUserId;
var arrOfFields = ['ID', 'Name', 'Title', 'EMail', 'Department', 'JobTitle', 'Notes', 'Picture',
'IsSiteAdmin', 'Created', 'Author', 'Modified', 'Editor', 'SipAddress', 'Deleted'];
var item = getItemById(userListGuid,UserId,arrOfFields);
if(item != null){
for(i=0;i<arrOfFields.length;i++){
if(item[arrOfFields[i]]!=null){
uiObj[arrOfFields[i]] = item[arrOfFields[i]];
}else{
uiObj[arrOfFields[i]] = '';
}
}
return uiObj;
}else{
for(i=0;i<arrOfFields.length;i++){
uiObj[arrOfFields[i]] = "User with id " + UserId + " not found.";
}
return uiObj;
}
}
Hover over the code, select “view source”, highlight and copy. Save as “ChartUsingGoogleVisualizationAPI.js”, mind the file extension, and upload to the scriptlibrary as shown above.
The article is not finished and will be updated with examples and more info, please be patient…
Examples
This example shows a web part page with 3 CEWP’s. The top two holds a <div> with unique id’s. The bottom one holds the code that calls the “chart builder” with an array of the id’s of the “containers” set in the top two CEWP’s:

The “container div” can be inserted in a CEWP holding text or other content.
You must ensure is that the CEWP holding the script are placed in the bottom (right) web part zone to ensure that the containers are rendered before the code “needs them”.
Regards
Alexander
Like this:
Like Loading...