Category Archives: Charts

SPJS Charts for SharePoint v3.x

10.12.12 I introduced a new bug in v3.3.7 that broke the filter if you did NOT use “filterAdditionalCharts”. This should be fixed in v3.3.8.


13.11.2012 Updated to v3.3.7 to fix a bug regarding “filterAdditionalCharts” in the Custom CAML filter setup. This was broken in v3.3.6 – thanks to Paul Brown for notifying me.

Please note that you now have to supply the parameter for each filter in the filter setup. Click the “Instructions” link above the filter setup textarea for details.


20.09.2012 Updated to v3.3.5
06.09.2012 Updated to v3.3.1. This update is an attempt to fix an issue where you apply multiple formatters on the same column, and only the last one sticks.
18.07.2012: Updated to v3.3 and added a few new features. See this article for details.
07.06.2012: Updated to v3.2.2 to add support for special characters like single quote and “&” in the filter options. See change log.
29.05.2012: Updated to v3.2.1 to fix a bug. See change log.
31.03.2012: Updated to v3.2.
Added filter wildcard to allow “Show all” when using dropdown filter. See “Filter setup Instructions” in the “Edit chart GUI”.
See change log for details on some small bugfixes.
21.02.2012: Updated to v3.1.5. See change log.
14.02.2012: Updated to v3.1.4. See change log.
13.02.2012: Updated to v3.1.3. See change log.
06.02.2012: Updated to v3.1.2. See change log.


06.02.2012: Updated to v3.1.1 to avoid using eval. Read more in the article. Thanks to Christophe for pointing me to the “jQuery.parseJSON()” method – I was not aware that jQuery had this built in.


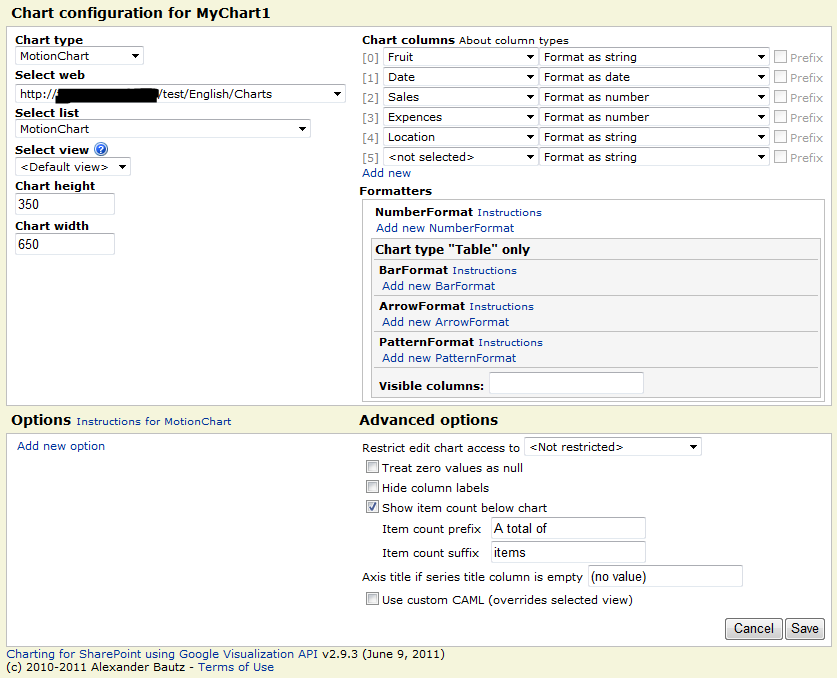
This article will freshen up on the setup of the solution and will describe the changes in v3.1

Keywords: New chart types, multiple dropdown filters and variables in the custom CAML query.


I have “silently” released version 3 of the “Charting for SharePoint using Google Visualization API” solution in November 2011. You find it here. The 3.0 release was not so mush about new functionality, but focused more on tidying up the GUI to make it easier for the user to understand the configuration options.

In the work with v3.0 i realized that i did not have any distinct name for the solution, and I decided to name the solution SPJS Charts for SharePoint.

A full walktrough of the configuration options in v3.0 can be found in this book from O’Reilly. The book is a collection of articles from Nothing But SharePoint. The article you find in this book (Publication Date: February 24, 2012) has not been published elsewhere.
The setup

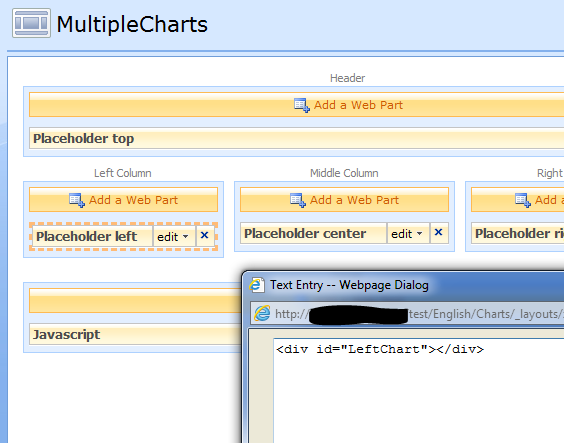
To start using this solution, you only need the rights to create a list (will be done automatically by this solution), upload files and add a CEWP or a HTML form web part to a page.

After the initial setup, all you need is contribute rights to edit charts.

The setup process contains four steps:

  1. Download the file “SPJS_ChartsForSharepoint_v3.x.js” and “CEWP.txt” from here from here. You can choose between the uncompressed (124KB) “SPJS_ChartsForSharePoint_v3.1.js” and the packed, smaller version version (64KB) “SPJS_ChartsForSharePoint_v3.1_min.js”. The latter is packed using packer. You find the CEWP code and the script file in separate folders. The folder name will reflect the script version. Ensure you download the latest version, and that you read the change log.
  2. Upload the file “SPJS_ChartsForSharepoint_v3.x.js” to a document library, or put it in a folder created with SharePoint Designer for safer storage. Ensure all users have read access to the file.
  3. Copy the link to the file “SPJS_ChartsForSharepoint_v3.x.js” and replace the example path in the CEWP code so that it reflects your local copy.
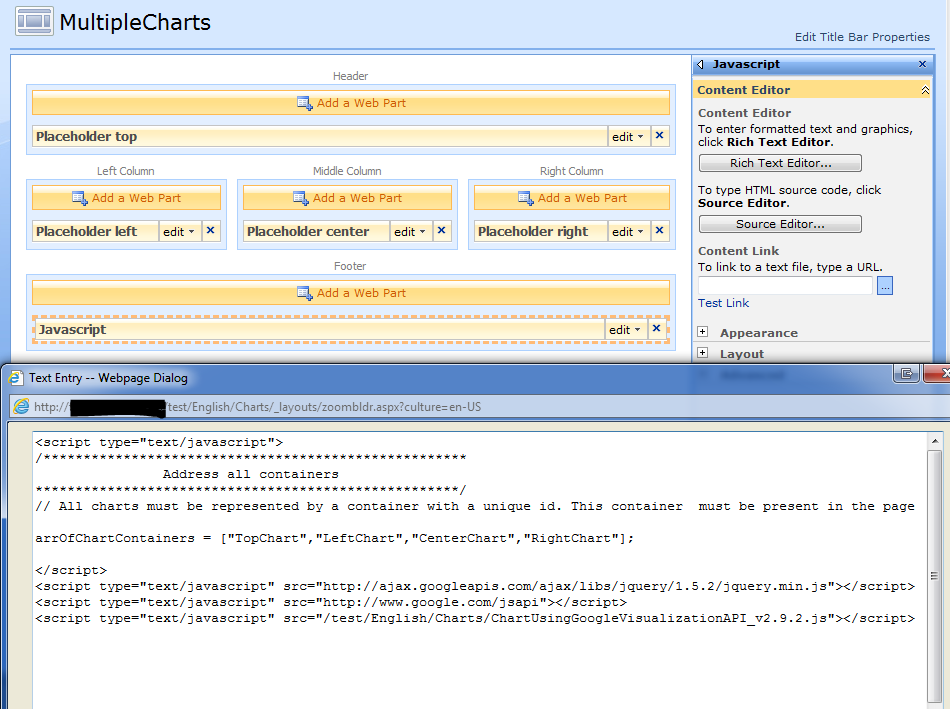
  4. Either upload the CEWP code to the same folder as the file “SPJS_ChartsForSharepoint_v3.x.js” and use the content link option in a CEWP to link to the code, or use a HTML form web part and insert the code directly in the “Source editor”.

Reload the page, and if it is the first time it is run in the site, the solution will prompt you to create the configuration list. If you are upgrading from an earlier solution, you are prompted to update the configuration list. Both actions require no more than a click on the OK button to complete.

If you are upgrading AND you have a multi language setup:
Ensure you have selected the “native” language for the site collection before you complete the update of the configuration list. If you fail to do so, the update will not take effect and the prompt will not go away.
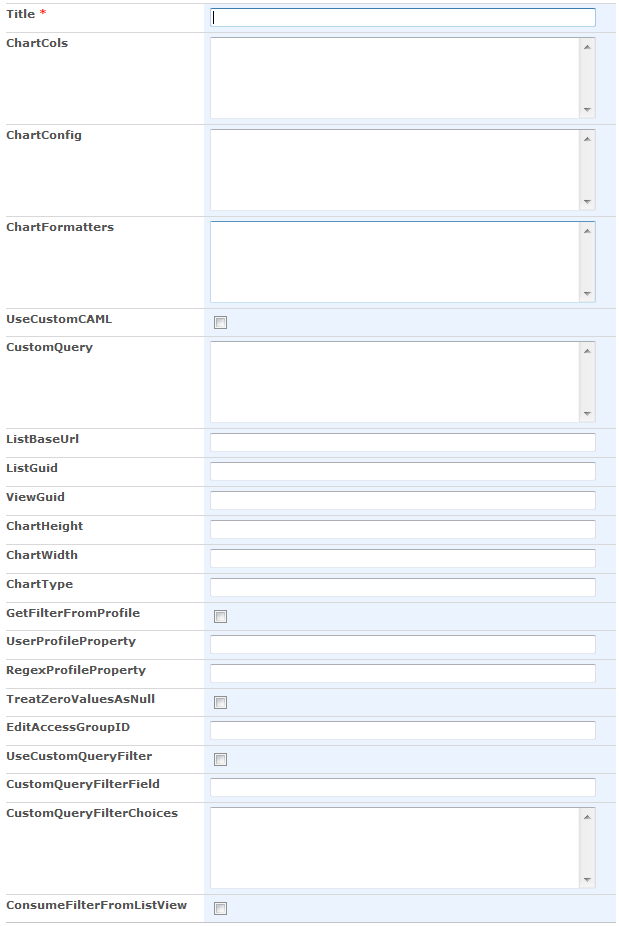
These are the changes in v3.1
Chart types

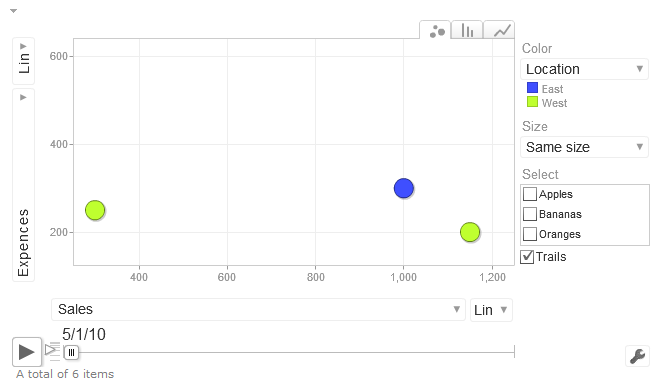
Switched GeoMap for GeoChart and added BubbleChart and SteppedAreaChart.

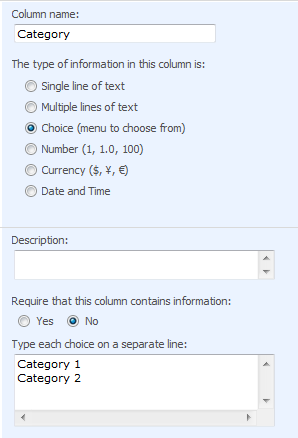
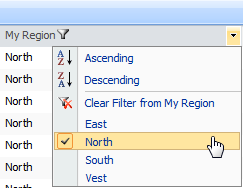
Dropdown select filters

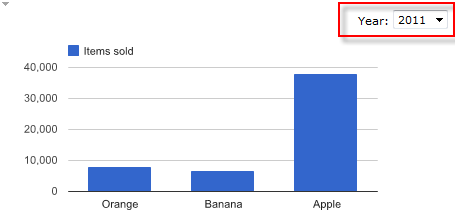
In the previous versions, you could create ONE dropdown filter above the chart. In v3.1 you can have multiple. The setup of the filter have changed, and those updating from a previous version will have to redo the filter setup (you will get an error message telling you that the filter setup is wrong).

IMG
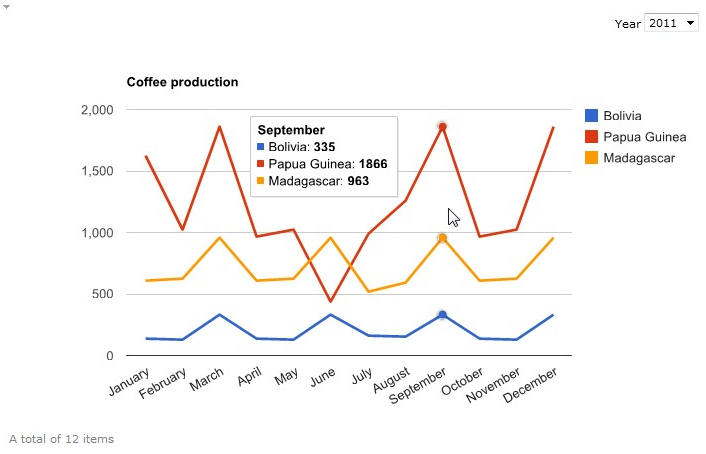
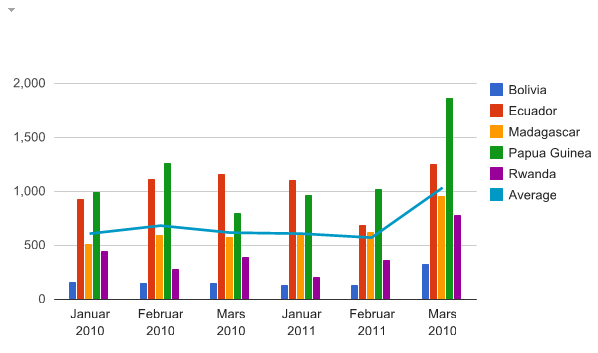
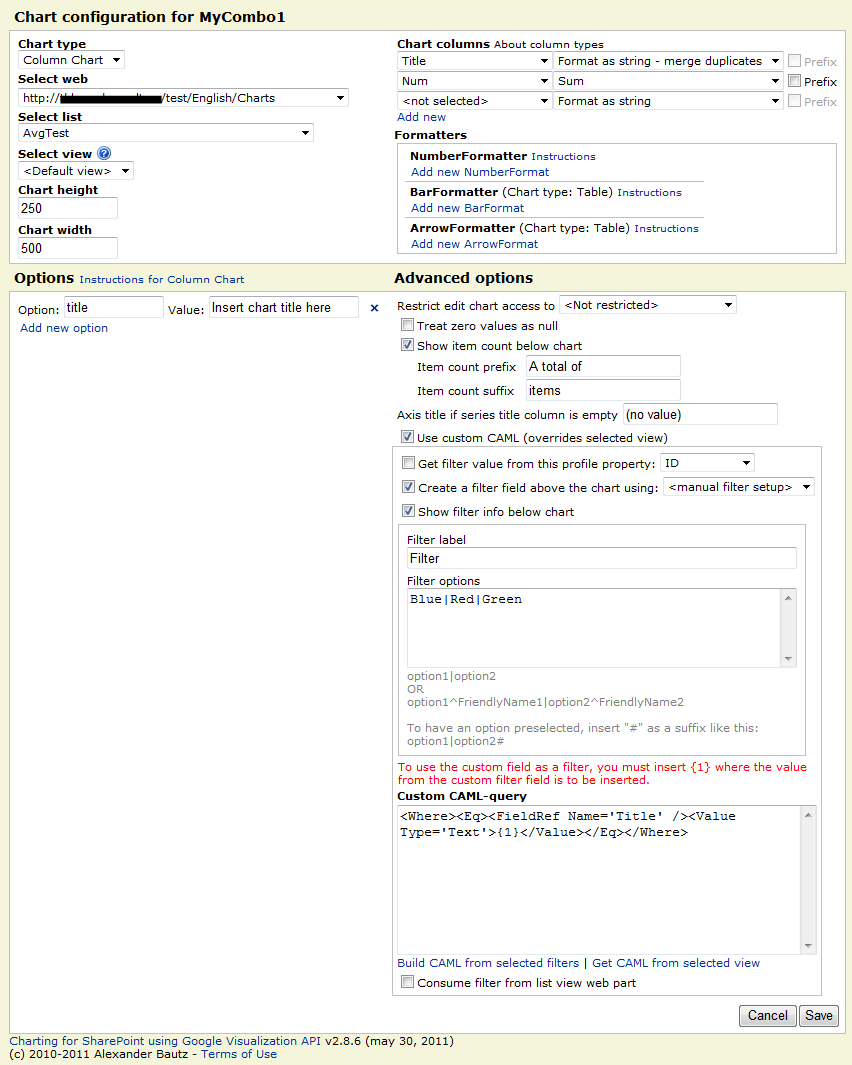
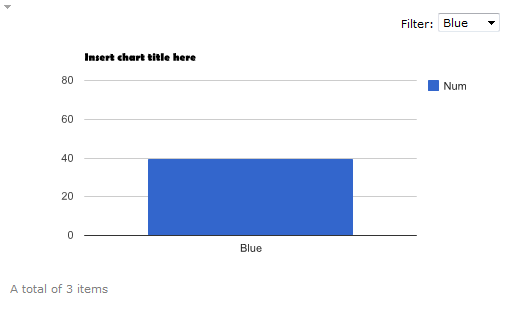
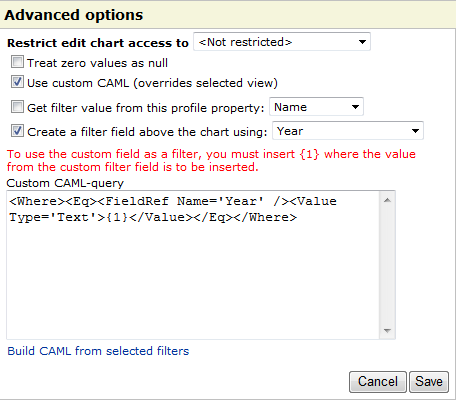
The chart example above has this filter setup to create the “Year dropdown”:

IMG
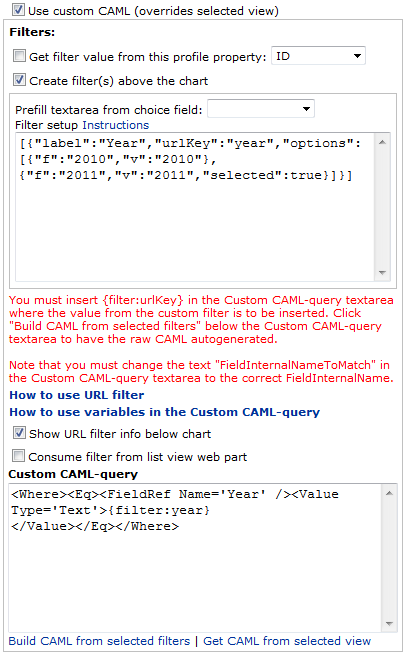
You can have multiple filters created in the same way, Click “Instructions” above the Filter setup textarea to expand this description:

Use an object literal like this:
[{“label”:”Year”,”urlKey”:”year”,”options”:[{“f”:”2011″,”v”:”2011″},{“f”:”2012″,”v”:”2012″,”selected”:true}]},{“label”:”Status”,”urlKey”:”status”,”options”:[{“f”:”Not started”,”v”:”0″},{“f”:”In progress”,”v”:”1″,”selected”:true}]}]

The object properties:
label: The label in front of the dropdown.
urlKey: The parameter in the url that identifies the value.
f: Friendly name for the option. Can be the same as “v”.
v: Internal name for the option. Can be the same as “f”.
selected: true if the option should be preselected.

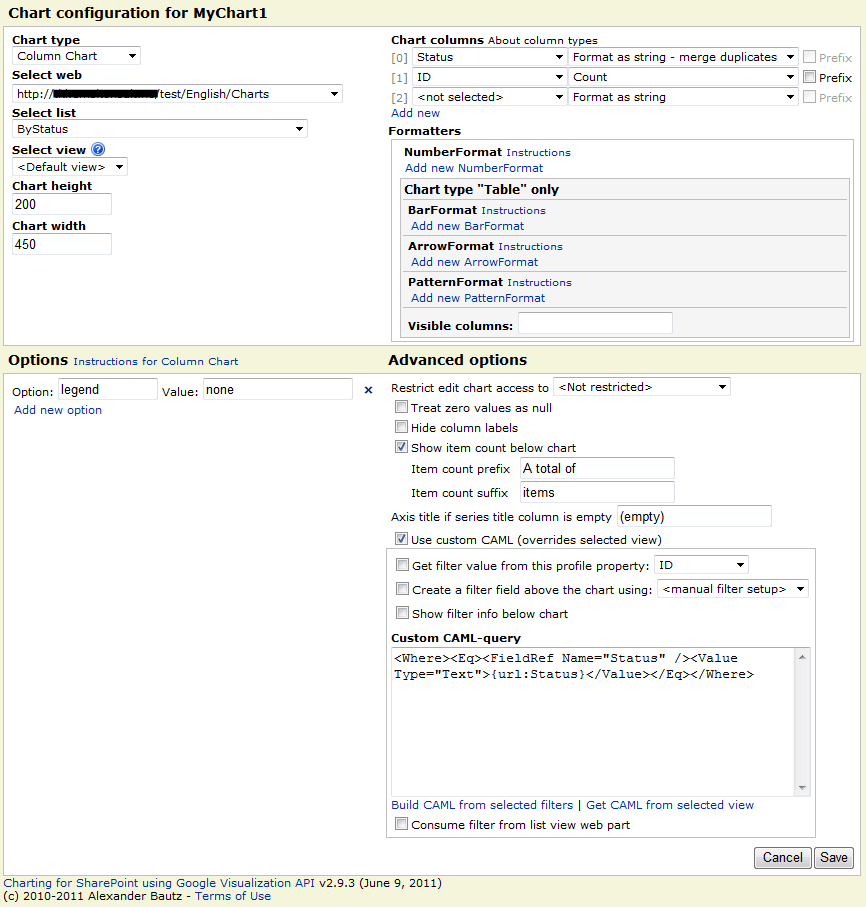
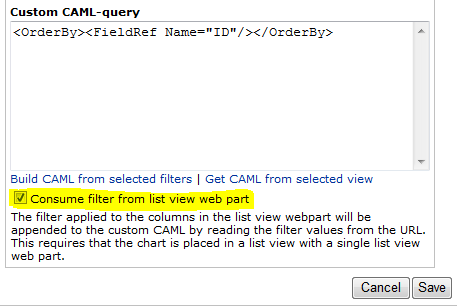
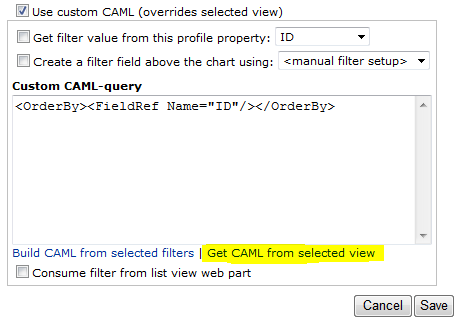
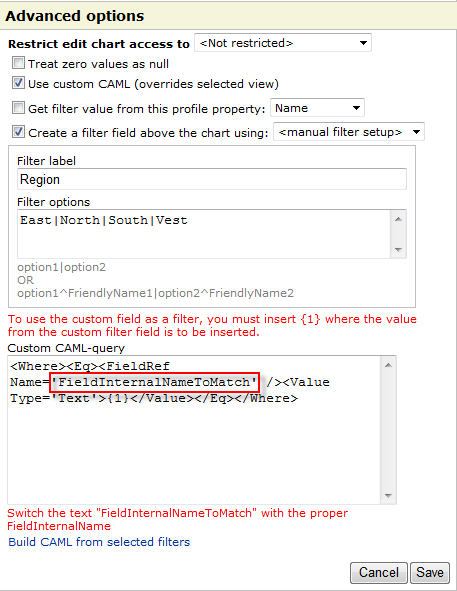
When you have written or prefilled the filter (by selecting it from the “Prefill textarea from choice field-dropdown”), you must add the appropriate CAML in the “Custom CAML-query” textarea. You can start by clicking “Build CAML from selected filters” below the Custom CAML-query textarea to have the raw CAML autogenerated.

Note that you must change the text “FieldInternalNameToMatch” in the Custom CAML-query textarea to the correct FieldInternalName.

The new filter method can use eval1, and thus you can have parts of, or even the complete filter as a variable in the CEWP. To do this, you create a variable in the CEWP code and inserts the variable name in the “Filter setup” textarea. Please note that the CAML is “static” and you must insert the corresponding {filter:urlKey} in the Custom CAML-query textarea to pick up the filters.

1. This feature has changed from v3.1 to v3.1.1 and must now be turned on (off by default) to allow “eval”. This is a security risk, but if you want to have the filter setup as a variable in the CEWP code, add this setting to the CEWP:

var allowEval = true;
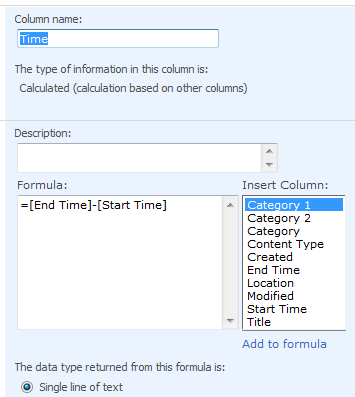
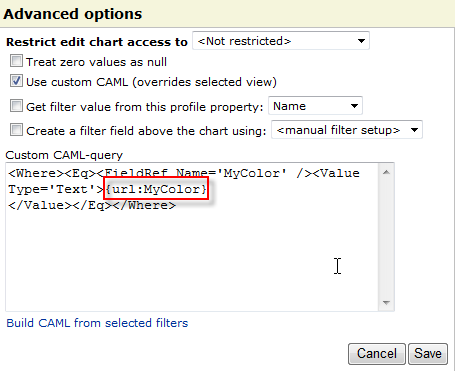
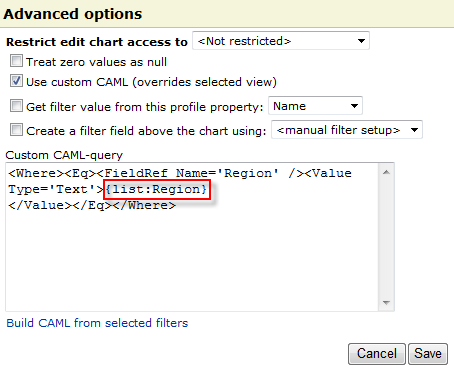
Variables directly in the custom CAML

Another new feature is the ability to use variables directly in the CAML. Construct the variables in the CEWP code like an object named “spjsCAMLvariables”, then insert {variable:variable_name} in the Custom CAML-query textarea where you want the variable to be inserted. “variable_name” represents one property from the object “spjsCAMLvariables”.

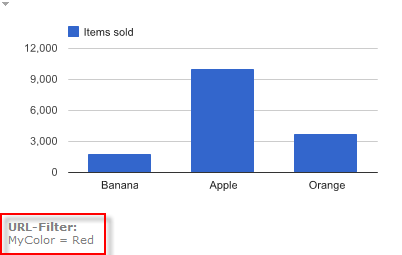
In the following example i have used it to filter a calendar to show this weeks items.
In the CEWP code you insert code like this to get the two variables “thisWeekMonday” and “thisWeekSunday”:

// Get todays date
var today = new Date();
// Find monday in current week
while(today.getDay()!==1){
	today.setDate(today.getDate()-1); 
}
// Create two date objects - one for Monday and one for Sunday
var monday = new Date(today);
var sunday = new Date(today.setDate(today.getDate()+6));
// Convert the dates to ISO8601 format: yyyy-mm-dd for use in CAML
var thisWeekMonday = monday.getFullYear().toString()+"-"+(monday.getMonth()+1).toString()+"-"+monday.getDate().toString();
var thisWeekSunday = sunday.getFullYear().toString()+"-"+(sunday.getMonth()+1).toString()+"-"+sunday.getDate().toString();
// the object used in the Custom CAML-query
var spjsCAMLvariables = {"thisWeekMonday":thisWeekMonday,"thisWeekSunday":thisWeekSunday};

Insert the variables in the Custom CAML-query textarea like this:

<Where>
<And>
<Geq>
<FieldRef Name='StartDate' /><Value Type='DateTime'>{variable:thisWeekMonday}</Value>
</Geq>
<Leq>
<FieldRef Name='StartDate' /><Value Type='DateTime'>{variable:thisWeekSunday}</Value>
</Leq>
</And>
</Where>

Hit “Save” and your chart will always show the current weeks items.


The Google Visualization API team periodically releases a new version of the Google Visualization API. While the Visualization API team thoroughly tests each new version, bugs may still exist in any new release. You can test the release candidate before it becomes official by setting a variable in the CEWP code like this:

var loadRC = true;
Note on configuration option:
I have changed from “eval” to “jQuery.parseJSON” to handle the configuration options. The new method is a bit more picky on the syntax of the parameters and you must ensure to use double quotes and not single quotes for the option value.

Example:
Wrong syntax
colors:[‘red’,’#004411′]
Correct syntax
colors:[“red”,”#004411″]


If you use this solution, please consider buying me a beer!

Alexander

Charting for SharePoint using Google Visualization API: Update 16.08.2011

26.08.2011 v2.9.3.2 has been released with these changes:
Small fix to allow single quotes in chart options. This is necessary to handle “fontName” in IE – it has to be wrapped in double AND single quotes like this:

{color:"red",fontName:"'Arial'",fontSize:14}

24.08.2011 v2.9.3.1 has been released with these changes:

  • For non-site collection administrators on a managed path*, there were a bug with how the baseUrl of the site was found. This led to an error when retrieving the fields for the selected list.
  • For non-site collection administrators, the “Get CAML from selected view” did not work.
  • Due to incompatibility i have removed the possibility to filter the chart on a DateTime column when using “Consume filter from list view web part”.
  • In orgchart there were a blank box added to the top of the “tree”. This is now gone.
  • Better debug – see details below.
  • Added support for a selection handler for use when you want to click the chart and redirect to a filtered list view. See example below.

Managed path

When you are on the root site in your site collection, does the URL look like this:
http://www.contoso.com/default.aspx
or like this:
http://www.contoso.com/sites/mysite/default.aspx

The last one would indicate that you are on a managed path.

Debug
Add this to the CEWP code:

var chartDebug = true;

When you edit the chart, a debug panel will be added to the top of the screen. This might come in handy if you need my help to debug the setup.

Filter example
The script is setup with a “listener” that lets you add a function like this to your CEWP code:

function chartSelectionHandler(data,chart,chartID){
	var selection, item, x, y, z;
	selection = chart.getSelection();
	if(selection.length>0){
		item = selection[0];
		if(item.row!==undefined){
			x = data.getFormattedValue(item.row, 0);
			if(item.column!==undefined){
				z =  data.getFormattedValue(item.row, item.column)
				y = data.getColumnLabel(item.column);
			}
		}
		if(x===undefined && y===undefined && z===undefined){
			return;
		}
		// Create your filter
		alert("These are the variables you can use for your filter:nnx = "+x+"ny = "+y+"nz = "+z);
		if(confirm("Open filtered list?")){
			if(chartID==='MyChart1'){	
				window.open('/test/English/Charts/Lists/ByStatus/AllItems.aspx?FilterField1=Status&FilterValue1='+x,'','width=1000');
			}else if(chartID==='MyChart2'){	
				window.open('/test/English/Charts/Lists/Coffee2/AllItems.aspx?FilterField1='+y+'&FilterValue1='+z,'','width=1000');
			}
		}
	}	
}

This is meant as an example for those who want to experiment with this feature.


16.08.2011 I have posted a new version of the “Charting for SharePoint using Google Visualization API” – v2.9.3. You find it in the download section below.

These are the changes in this release


Save as template:
I have added a new checkbox to the configuration: “Use display name for list and view”. This one will replace the GUID with the display name for the list and view in the chart configuration. By doing this, the chart will “survive” if the site is saved as a template end restored in another location.

Use this option only if you plan to use the site as a template.

If you have a setup with multiple languages and you have translated the list title, the chart will work only for the language used when the template was saved. You can however revert back to using the GUID as soon as the site has been created from the template by removing the check in “Use display name for list and view” and saving the configuration.

Chart options:
Fixed a bugs where some options starting with 0 – like region for charts – were parsed as a number thus removing the leading 0.

Minor bugfixes:
I have done a few small bugfixes that are to small to mention.


Other articles in this series:


Download

You find the code here

If you use the solution, please consider donating a few dollars.

Regards
Alexander

Interactive Charts using Google Visualization API: Examples

This post describes the use of the tool posted here. The latest changes are found here.


This post will be updated with examples on how to utilize this tool to build various charts. I will add examples upon request. If you have a smashing chart or a special trick, please send it to me and i will post the images here.


Combo chart

The chart:
IMG

The list:
IMG

The configuration:
IMG

The reason for using “chartArea.left:50” is to align the chart left so that the legend is not truncated.

NOTE: The “Column index” used when setting up the series is one notch down from the index shown to the left of the columns. This has to do with the series only applying to the numeric columns.


How to put multiple charts in one page

Here is a few screenshots showing how to put multiple charts in one page.
IMG

IMG

IMG

You must ensure that the CEWP holding the code is placed below all containers.


Motion chart

The chart:
IMG

The list:
IMG

The configuration:
IMG


URL filter

This filter is applied in the “Custom CAML” section like this:
The configuration:
IMG
Use the FieldInternalName of your field – my field is named “Status”.

The URL:
IMG

The chart:
IMG

Manual filter setup filter

This is used to filter on “Single line of text” columns. This filter is applied in the “Custom CAML” section like this:
The configuration:
IMG
To get the CAML, select the checkbox “Create a filter field above the chart using”, select “manual filter setup” and then click “Build CAML from selected filters”. You need to know the FieldInternalName of the field and insert it in the placeholder in the CAML.

The list:
IMG

The chart:
IMG

Grouped by choice column value

I got a request from Michael:

Hello,
Im trying to chart a Calendar, i created a Column called “Category” (its a drop-down box with the categories)
Now i want to create a chart that:
– is a bar chart
– the h axis is “created by”
– the v axis is a the sum of a column that calculate the hours between end and starttime of events (allready solved this with a formular)
– the Bars are grouped by the Creator
– the chart is stacked (allready done)
– the stacked bars show the name of the category
– for each category a specified colour

Here are some screenshots of the list fields

The “Time” field calculates the difference between start and end:
IMG

The Category field is a plain choice field:
IMG

The series in the chart are made up by one calculated column per choice in the “Category” field:
IMG
Make one for each category.

The configuration:
IMG

The chart:
IMG


Please make requests, and i will post examples to the best of my knowledge.

Alexander

Charting for SharePoint using Google Visualization API: Update 05.06.2011


I have posted a new version of the “Charting for SharePoint using Google Visualization API” – v2.9.0. The changes are described here, but the background story and the code is found in original article. This post describes the new features in v2.9.0.

You should read the original post found here, the update for v2.8 posted here and the update for v2.8.5 posted here.


Changes from v2.8.5:

  1. Changed the behavior of “Average” to divide the grand total on the number of columns actually containing a value. This means any columns being blank or “null” will not be considered into the “total column count”. Thanks to Ayodele Ayodeji for pointing this out to me.
  2. Changed the “Chart option parser” to use eval on the Chart Options. YES i know it’s not the smartest thing to do, but as the Google Visualization API changes, my crude “option parser” failed to swallow some of the object literation formatted options.
  3. Added new chart types: Combo Chart and Candlestick Chart
  4. Added support for PatternFormat
  5. Pulled the variables: “showFilterInfo”, “showItemCount”, “itemCountPrefix”, “itemCountSuffix”, “labelIfEmpty”, introduced in v.2.8.5 in from the CEWP code and into the Chart configuration. This update should override the CEWP settings and these obsolete settings should not interfere.
  6. Added a few minor GUI tweaks like auto open the configuration for a newly added chart – no more “Table has no columns” error. Changed some of the error message. And a few other small fixes.
  7. Changed the solution to check for any missing columns in the configuration list and add them as needed. No more need to manually add columns to the configuration list when updating from a previous version!
  8. I have changed the code for the “save configuration function” as jQuery v1.6 introduced a new approach on DOM attributes and properties which affected the value returned by .attr(“checked”). This made saving “checked” checkboxes impossible when using jQuery v1.6.x.

NOTE: I have done one change in the way the formatters are targeted to a column. I originally went for a numbering of the columns starting with 1, but changed this to use 0 for the first column. This has to do with the columns being 0-indexed in the DataTable “behind the scenes” and this making things easier. To those of you using formatters now, you might end up with an error message, but it is just a matter of notching the “index” down by one.

If you use this solution, please consider donating a few dollars.

Charting for SharePoint using Google Visualization API: Update 05.05.2011


I have posted a new version of the “Charting for SharePoint using Google Visualization API” – v2.8.5. The changes are described here, but the background story and the code is found in original article. This post describes the new features and changes from v2.8.

You should read the original post found here, and the update for v2.8 posted here.


Changes from v2.8:

  1. Removed option to “listen to” specific list filter columns using “{list:FieldInternalName}”
  2. Added option to “consume” a list view web part filter (read from the URL). You can now have the chart “connected” to a list view. Further details below. This new feature requires existing users to manually add one column to the configuration list: “ConsumeFilterFromListView”.
  3. Fixed a bug regarding the use of “&” in a custom filter field which broke the CAML
  4. Added a “counter” to display the total number of items below the chart
  5. Added a few “options” to be set in the CEWP code: “showFilterInfo”, “showItemCount”, “itemCountPrefix”, “itemCountSuffix”, “labelIfEmpty”. All these have a default value and are optional.
  6. Added option to pull the CAML from an existing list view to use as “Custom CAML”

Details on item number 2:

In v2.8 i introduced an option to “hook into” the list view veb part filter for specific columns. In this release this is removed and replaced with an option to “connect to” a list view web part and consume all filters applied to any column.

This has a few limitations:
It reads the filter values from the URL and therefore only one list view webpart can coexist with the chart. If more than one list view web part is placed alongside a chart, it would not know which list the filter came from.

To use this option, check this box:
IMG

This requires existing users to add one column to the configuration list: “ConsumeFilterFromListView”. For new users this field will be added automatically when creating the configuration list. The chart configuration list should look like this:
IMG

Details on item number 4:

I have added a “counter” to display the total number of items below the chart:
IMG
This counter can be switched off – see next item.

Details on item number 5:

These variables can be added to the CEWP code:

  • showFilterInfo: true [default] or false. Controls the visibility of the “filter label” below the chart when using a filter.
  • showItemCount: true [default] or false. Controls the visibility of the item count below the chart.
  • itemCountPrefix: A string to put in front of the item count. Default empty string.
  • itemCountSuffix: A string to add after the item count. Default ” items”.
  • labelIfEmpty: A string representing the default label for empty values. Default is “(empty)”.

Example CEWP code:

<div id="MyChart1"></div>
<div id="MyChart2"></div>
<script type="text/javascript">
/*****************************************************
		Address all containers
*****************************************************/
// All charts must be represented by a container with a unique id. This container  must be present in the page
arrOfChartContainers = ["MyChart1","MyChart2"];

var showFilterInfo = true;
var showItemCount = true;
var itemCountPrefix = "A total of ";
var itemCountSuffix = " items";
var labelIfEmpty = "(no value)";

</script>
<script type="text/javascript" src="http://ajax.googleapis.com/ajax/libs/jquery/1.5.2/jquery.min.js"></script>
<script type="text/javascript" src="http://www.google.com/jsapi"></script>
<script type="text/javascript" src="/test/English/Charts/Javascript/v2.8.5/ChartUsingGoogleVisualizationAPI.js"></script>

Details on item number 6:

Use this link to pull the CAML from the list view:
IMG
Select a view in the “View selector” and click this link to pull it into the textarea.


Please post a comment if you have questions.

Alexander

Charting for SharePoint using Google Visualization API: Update 27.03.2011

05.05.2011 I have released version 2.8.5. Read about it here


I have posted a new version of the “Charting for SharePoint using Google Visualization API” – v2.8. The changes are described here, but the background story and the code is found in original article. This post describes the new features.


1. Filter the chart using a choice column from the list

IMG
The dropdown is created from the choice options supplied in the list settings for that column. You set the filter in the GUI like this:
IMG
You must use “custom CAML” and select “Create a filter field above the chart using”. In the dropdown you will find all the single-choice columns in your list. Click on the text “Build CAML from selected filters” to create the appropriate CAML query.


2. Manually build the dropdown filter

If you want to make a dropdown filter for your chart, filtering by a text in a single line choice column you can create it like this. Click “Create a filter field above the chart using”, and select “manual filter setup”. You can then build the filter manually. See the description below the “filter options” textarea for formatting options for the dropdown.

When using a manual filter setup and using “Build CAML from selected filters”, you must change the “FieldInternalNameToMatch” with the proper FieldInternalName of your target field in the CAML. In this example, switch the text “FieldInternalNameToMatch” with “Region”.
IMG
IMG


3. Filter the chart using a value from the URL query string

Use {url:ParameterName} as placeholder in the CAML.
IMG
Before the list is filtered, the chart looks like this:
IMG
Pass the filter in the URL like this:
IMG
IMG


4. Filter the chart by filtering the “attached” view

This only applies if the chart is in a page with a single list view. It reads the filter provided by the list filter action and filters the chart accordingly. There are no real connection between the list and the chart – it merely reads the URL and looks for a filter value matching the placeholder in the CAML.

Use {list:FieldInternalName} as placeholder in the CAML.
IMG
Before the list is filtered, the chart looks like this:
IMG
Filter the list by the appropriate column to render the chart.
IMG
IMG


Important

Users upgrading from v2.7 must add three columns to the configuration list:

  • UseCustomQueryFilter: Yes/No column (boolean)
  • CustomQueryFilterField: Single line text
  • CustomQueryFilterChoices: Multi line plain text

For new users, this list is automatically created, but for users upgrading from older versions these fields must be added manually. In that case, compare your configuration list with this image:
IMG


Bugfixes:
If a column name had “&” or “/” in it, the chart “broke”. Thanks to Eric Guy for finding the bug.

I might very well have forgotten something in this walktrough so please post any comment or question below.

Alexander

Poll for SharePoint

March 15, 2015: I have updated this solution. You find v2.0 here.

Please note: The Google Image Charts used in this solution is deprecated and will stop working April 20, 2015.

Change log
January 28. 2014
v1.54 fixes one incompatibility with SP 2013. I have not fully tested this so please let me know if you find any bugs.

July 01. 2013 v1.53: The sort order of answers in chart now reflects the order given in the setup. I have removed some script references so that you now must refer spjs-utility.js – get it here

You must update the CEWP code to include reference to spjs-utility.js

15.12.2011 v1.5.1: Bugfix in the file “PollForSharePoint.js” – line 238. The property “listBaseUrl” were missing – thanks to Jaap Dijkma for finding this bug.


04.12.2011 I have updated the solution to support putting the list in a central location. See “listBaseUrl” below.


22.10.2011 Updated the code to support free input rather than predefined answers – as requested by Claudia:

Hi, thank you for this wonderful piece of code, I think it’s great and we use it on our intranet :).
I wondered if it is possible to use a single line of text for free input instead of radiobuttons with preset answers?
We like to use the poll for ‘brandtagging’ so that people can type keywords.
Just wondering…..
thanks! Claudia

I thought this was a clever idea and have implemented this in v1.4. See updated CEWP code and description below.


17.08.2011 Updated the code with these changes:

  • Lets you view the results and come back to answer.
  • Tidied up the code.
  • The charts now supports https (Thanks to Google).
  • Removed the poll question from the chart title to preserve the formatting.

01.03.2011 Updated the code to fix a bug when “singleResponse” is true. Thanks to “Al”. I have also included two more settings in the “argObj”: qStyle and aStyle. These sets the CSS style of question and answers. See CEWP code below.


28.11.2010 Updated the code to support special characters in the poll question and answers. Thanks to Christophe for the tip.


This code lets you generate polls using JavaScript/jQuery only. No need for server side installed WebParts.

Poll
IMG

Result with column chart
IMG

Result with bar chart
IMG

Result with pie chart
IMG

Result with “table chart”
IMG

Already answered
IMG

Not active
IMG

Finished
IMG

The charts are generated using Google Chart Tools / Image Charts (aka Chart API).


Create a custom list with the following fields

  • Answer: Single line of text
  • Question: Single line of text

Name it anything you like, but keep the display name fairly simple (no special characters) as you will use the display name in the CEWP code.

CEWP code

The CEWP code below refers jQuery from Google. If you have a local copy of jQuery you can change the script src. You find the code for the file “PollForSharePoint.js” at the bottom of the page. In this example the file “PollForSharePoint.js” is placed in a document library named “Javascript”.

NOTE: You must change the script src for the file “PollForSharePoint.js” and “spjs-utility.js” to point your instance of the files – the CEWP code will not work unless you do this.

Place this code where you want the poll to appear:

<script type="text/javascript" src="http://ajax.googleapis.com/ajax/libs/jquery/1.9.1/jquery.min.js"></script>
<script type="text/javascript" src="/test/English/Javascript/Poll/spjs-utility.js"></script>
<script type="text/javascript" src="/test/English/Javascript/Poll/PollForSharePoint.js"></script>
<script type="text/javascript">

buildQueryWP({pollAnswerListName:'PollA',
				listBaseUrl:L_Menu_BaseUrl,				
				id:'myPoll_01-03-2011', // Allowed characters id a-z, 0-9 - and _
				start:'10/22/2011', // format: mm/dd/yyyy
				end:'11/10/2011', // format: mm/dd/yyyy
				singleResponse:false,
				q:"What is your<br />favorite junk food?",
				qStyle:'font-size:small;font-weight:bold;color:gray',
				aStyle:'font-size:xx-small',
				a:['Pizza','Hot dog','Hamburger','Neither of them'], // Leave empty for free input				
				color:['32CD32','FFCC11','FF3300','C0C0C0'],
				forceLowerCaseAnswer:false, // Group result by lowercase				
				chart:'col', // table, bar, col or pie
				height:100,
				width:450});
</script>

You can control these values in the top of the file “PollForSharePoint.js”:

var submitLinkText = 'Submit';
var backLinkText = 'Back';
var showResultBtnText = 'Show result';
var pollNotActiveText = 'The poll is not active prior to {0}';
var pollEndedText = 'The poll ended on {0}';
var alreadyRespondedText = 'You answered: ';
var totalResponsesLabel = "Total responses: ";

Object attributes explained

  • pollAnswerListName: DisplayName or GUID of the list that stores the answers
  • listBaseUrl: The baseUrl of the site. This is like “/sites/hr” when the list is located in the site “hr” under “/sites”. Use L_Menu_BaseUrl (or omit the property) for current site. New in v1.5
  • id: The unique id of the poll. All poll answers are stored in a list and this id is used to separate each poll
  • start: Start date in the format mm/dd/yyyy
  • end: End date in the format mm/dd/yyyy
  • singleResponse: true for one reply per user, false for unlimited number of replies
  • q: Poll question. To have a linefeed in the question, use <br>
  • qStyle: CSS syntax style
  • aStyle: CSS syntax style
  • a: Answers in an array format. To use free input and not predefined answers, leave the array empty.
  • color: Colors for the chart in an array format. This must have the same length as the previous parameter – one color for each answer
  • forceLowerCaseAnswer: Primarily for use with free input to avoid getting two “series” when the only difference are uppercase characters. New in v1.4
  • chart: “bar” for bar chart, “col” for column chart, “pie” for pie chart or “table” for a plain table.
  • height: Height in pixels
  • width: Width in pixels

Regarding free input
If you leave the attribute “a” as an empty array, the user can supply free text as “answer”. When using free input, the result are automatically presented as a table.

Download code

The code for the file “PollForSharePoint.js”:
Download code from this location

Ask if anything is unclear.

Alexander