To be able to easily add a chart to any page without the knowledge of JavaScript, you can create “Web Parts” in the “Web Part Gallery”. Follow these steps to be able to add a chart as you would any other web part:

First you must add two Content Editor Web Parts to a page using the “Master code”, and the “Slave code” from the setup instructions. Edit the Web Part and update these settings:
The master:
Under “Appearance”, change “Title” to “SPJS Charts for SharePoint: Master”.
Under “Advanced”, change the “Description” to “Use this Web Part to start building charts in the page. Use only one Master Web Part in each page. To load additional charts, use SPJS Charts for SharePoint: Slave.”.
The “Slave”:
Under “Appearance”, change “Title” to “SPJS Charts for SharePoint: Slave”.
Under “Advanced”, change the “Description” to “You must first add a SPJS Charts for SharePoint: Master web part to the page. Use this Web Part to load additional charts.”.
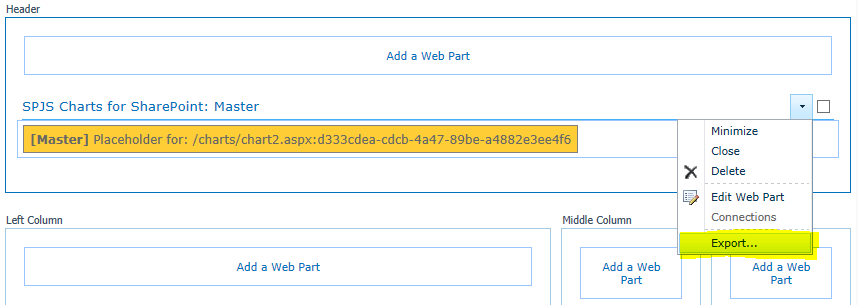
Save the changes to the web parts, and export them like this:

Save them locally, and then upload then to the “Web Part Gallery” by going to “Site settings” and selecting “Web parts” under “Galleries”. Upload them and add them under a custom Group named “SPJS”.

Now you can add the chart web parts as any other web parts to any page within the site collection.
Ask if anything is unclear,
Alexander
Hi Alexander,
I add a master and slave webpart in a sharepoint 2013 site collection but on page load it gives me below error.
“The container with id e830f7b6-4de7-4147-9474-da34aac29187 is not defined”
Could you please advise.
Thanks.
Hi,
Do you see any errors in the developer toolbar (hit F12 > Console)?
Alexander
Dear Alexander,
Can I have your email. I want to send you error messages as attachment.
B/Regards,
Muzaffar
You find it in the “About me” tab above.
Alexander