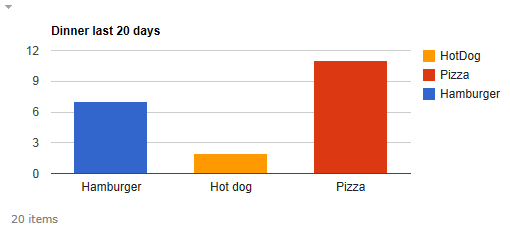
This function is used in SPJS Charts for SharePoint v4 to override / intercept the chart options before the chart is drawn. You must inset this function in the Master CEWP code for it to be available when the chart is about to be drawn.
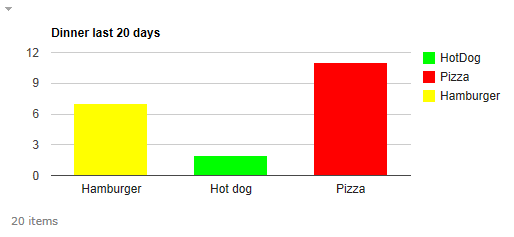
This example shows how you can color the series based on the values.
First without spjs_chartOptionOverride:

The override code:
function spjs_chartOptionOverride(chartId,data,options){
	// Color code the series based on the value
	if(chartId === "2ad99c9f-affd-4583-8146-54b03af7fa45"){
		var red = '#ff0000', green = '#00ff00', yellow = '#ffff00', value, i, j;
		options.colors = [];
		for(i = 1; i < data.getNumberOfColumns(); i++){
			value = 0;
			for(j = 0; j < data.getNumberOfRows(); j++){
				if(data.getValue(j, i) !== null){
					value += data.getValue(j, i);
				}
			}
			options.colors.push(value > 10 ? red : (value > 5 ? yellow : green));
		}
	}
	return options;
}
Please note that this override will only affect the chart with ID “2ad99c9f-affd-4583-8146-54b03af7fa45”.
Result:

Ask if anything is unclear,
Alexander
Is there any way to set when the colour changes?
I want to query another list and set the colours of each column dynamically. But my async query comes back after the chartoverride is called.
The function must be changed to target the other chart by id – look at the line:
if(chartId === "2ad99c9f-affd-4583-8146-54b03af7fa45"){...You can remove the “if” to have the override apply to all charts, or set in more chartIds in the to target other charts specifically.
if(chartId === "2ad99c9f-affd-4583-8146-54b03af7fa45" || chartId === "another_id_here"){...Alexander
I’m doing this within spjs_chartOptionOverride
function spjs_chartOptionOverride(chartId,data,options){ ExecuteOrDelayUntilScriptLoaded(someFunc, “sp.js”);
}
where someFunc is querying using the SP.ClientContext and executeQueryAsync to return the colors.
By the time all callbacks resolve, thespjs_chartOptionOverride is well and truly done.
I ended up solving this problem by calling “spjs.charts.draw(id, true)” after my callbacks returned. The result is the colours will be wrong for a little while before updating.
I could not comment and call spjs.charts.init() as it generated errors unless called from within the spjs charts file. Using IE8.
I see. I’m afraid there is currently no built in option to manually delay the function that builds the charts, but you might be able to hack it by running the minified js file trough this tool: http://jsbeautifier.org
And the comment out the last line:
Then add this line to the callback from your custom function.
Alexander