- Last updated
- General
- Data policy
- Current version
- Installation
- Localize the frontend UI
- Enter edit mode
- Basic setup
- Chart type
- Web, list and view
- Filter and Custom CAML
- Options
- Group, sort and substitute
- Drilldown and transpose
- Load external JS or CSS
- Formatters
- Import / Export
- License
- Help / About
- License code
- MUI
- Using variables in CAML Query and filter
- Attaching an event handler
- Load charts manually
- Create chart from custom datasource (SPJS Charts v7)
Last updated
May 04, 2020
SPJS Charts v6 and v7 will coexist because v7 only supports SharePoint 2013 +.
I haven’t had time to update the user manual for v7 yet, but most of the settings are the same – except from the ability to use a custom function to get the datasource. This is described here.
General
This solution used to create interactive charts from data stored in SharePoint lists. It uses the Google Visualization API to draw the charts.
This is a 100% client side solution that doesn’t require server side code. All you need is the rights to upload documents (the script files) to a document library, and to add a Content Editor Web Part to a page.
Data policy
Google’s data policy for most of the charts state:
All code and data are processed and rendered in the browser. No data is sent to any server.
The MAP charts will however send the coordinates / addresses to the Google Maps servers for processing.
Current version
The current major version is 6 for SP 2007 and 2010 and 7 for SP 2013+.
Installation
Download files
Video installation guide
Upgrading from an earlier version
SPJS Charts for SharePoint v6 and v7 are NOT backwards compatible with earlier versions. This means you CANNOT replace the script files in your current “/SPJS/Charts” folder.
You must add the two versions side-by-side in the SPJS library, and create new chart pages and import your existing charts into a chart web part created with the new installer.
Unzip and upload to a document library
Unzip, and upload to a document library named “SPJS” in the current site. The folder structure should be “/SPJS/Charts_v6/” or “/SPJS/Charts_v7/” depending which version you install.
If you already have SPJS Charts for SharePoint v5 installed, you must leave this folder as-is and add “Charts_v6” or “Charts_v7” folder alongside the already present “Charts” folder.
Storing the files in the site collection root
The default location for the SPJS Charts for SharePoint files is in the current site. If you however want to put the SPJS document library in the site collection root for sharing with multiple sites, you need to change the variable “spjs_folder_location” in the file “/SPJS/Charts_v6/SPJSCharts_loader.html” or “/SPJS/Charts_v7/SPJSCharts_loader.html” from “current” to “root” like this:
var spjs_folder_location = "root";
Insert API key for Google Maps
This is only required if you plan to use Google Maps.
As of June 2016 Google requires an API key in order to display Map charts on a web page that has not already used map charts prior to this date.
This key is free for up to 25000 page views per day, so all you need to do is to go to this page and click “Get a key”. You will need a Google account, but the key itself is free (no need to enter any credit card info).
July 27, 2017:
I have changed the method of specifying the API key for Google Maps in the file “SPJSCharts_loader.html” to ensure it is loaded correctly.
If you see the message “Oops! Something went wrong. This page didn’t load Google Maps correctly”, you must update your version of SPJS Charts to v6.1.5.6 or above, and include the API key like this in line 14 in the “SPJSCharts_loader.html” file:
var spjscharts_mapsApiKey = "your_key_here";
Replace the text “your_key_here” with your API key.
Insert a chart in a page
Copy the path to the file “/SPJS/Charts_v6/SPJSCharts_loader.html” or “/SPJS/Charts_v7/SPJSCharts_loader.html” and insert the link in the Content link field in a Content Editor Web Part (CEWP) in a page in your site to start configuring your first chart.
Create web part template [optional]
When you have created the first chart, you can save the CEWP as a template to be able to easily add the new chart without knowing the path to the script.
Edit the page, select “Export” from the little down-arrow in the top right corner of the CEWP. Save it locally, and then upload it to the “Web part gallery” in the root site of your site collection. Type in a name and description for the web part, and add it to a custom group named “SPJS Charts”.
When this is done, you can go to any page in your site collection and add it as any other web part to a page.
Localize the frontend UI
You can edit the file “/SPJS/Charts_v6/js/spjs-charts-i18n.js” or “/SPJS/Charts_v7/js/spjs-charts-i18n.js” to add your own translation for the labels and messages in the frontend UI. If you plan to use this option, ensure you include the script in the “SPJSChartsMaster_CEWP.html” file.
Enter edit mode
When you have added the chart web part to the page, you see this icon:
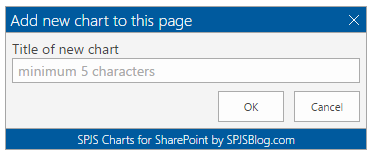
Click the icon to bring up the “New Chart form”:
Enter a name and hit OK to reload the page. You will see this message:
Click the ellipsis, and select “Edit chart”.
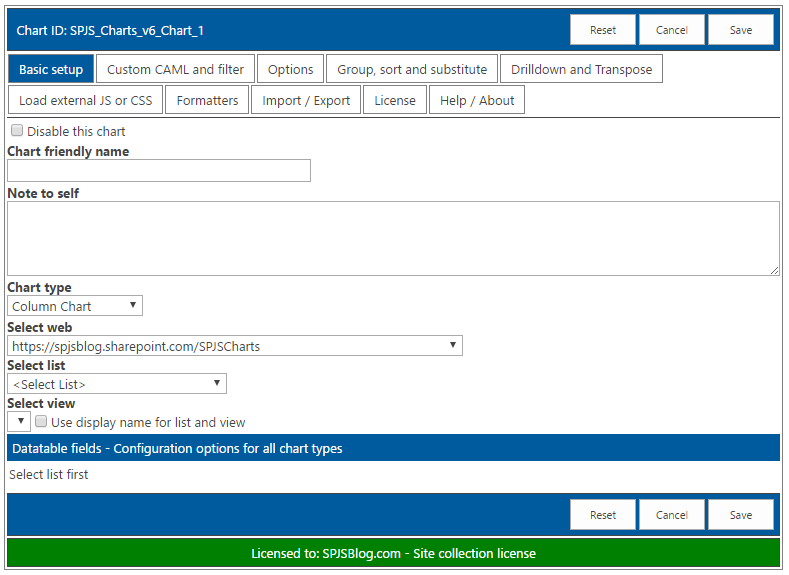
I’ll not go into details on every options so please post a question in the forum if you need more details.
Basic setup
Chart type
You can use most of the chart types available in the Google Visualization API.
Select a list to start configuring the chart. Add at least two columns to build the chart. Click the link Configuration options for all chart types in the chart configuration to see how you build the desired chart.
Web, list and view
Select the data source. If you plan to save the site as a template, you should select the “Use display name for list and view” as the GUIDs will be regenerated when you create a site from the template.
Filter and Custom CAML

In v6.0.1 BETA 3 I have changed how the filters are handled.
You are no longer required to use Custom CAML to be able to use filters, but you can still use Custom CAML if you prefer that.
Please note that the filter values from filters above the chart are no longer picked up in the Custom CAML itself, but is applied after the dataset has been returned.
This change means you must reconfigure any existing charts you have that uses the {filter:key} setup in the Custom CAML.
Filter data from URL
URL filters still need to be added to the Custom CAML like this:
<Where><Eq><FieldRef Name='Status' /><Value Type='Text'>{url:Status}</Value></Eq></Where>
Here you can write your own CAML. This is not covered here, but you can click the “Get CAML from selected view” to start form a predefined view.
Filters
If you want to use filters, you must click “Create filter(s) above the chart” checkbox to reveal this section:
You can use either a freetext filter, a dynamic filter based on the actual values in the datasource, or a predefined list of filter options. You can have multiple filters – just choose another field in the dropdown to automatically add it to the filter textarea.
Static filter
Here is an example of a “static” filter built from a “Year” column:
[
 {
 "label": "Filter by year",
 "key": "Year",
 "multiselect": false,
 "size": 3,
 "filterType": "select",
 "options": [
 {
 "f": "All",
 "v": "*",
 "selected": true
 },
 {
 "f": "2015",
 "v": "2015"
 },
 {
 "f": "2016",
 "v": "2016"
 }
 ]
 }
]
Dynamic filters
The filter setup is automatically generated using the controls above the filter textarea. Here is an example:
[
 {
 "label": "Task status",
 "key": "Status",
 "multiselect": false,
 "size": 3,
 "filterType": "select",
 "cascade": true,
 "ascending": true,
 "selectedValue": "Deferred",
 "showAllOption": true
 }
]
Filter options
label
The label in front of the dropdown.
key
This is the FieldInternalName of the field you are filtering.
multiselect
Set this to true to have the possibility to select multiple values in the filter select.
size
Set the size of the multi select control.
filterType
This is either “text” or “select”.
cascade (dynamic filters)
The parameter “cascade” determines whether or not to show only the filter values available in the current filtered datasource, or to show all options from the original unfiltered datasource.
ascending (dynamic filters)
Use this attribute to control the sort order of the dynamic filter options. Use true or false.
selectedValue (dynamic filters)
Use this attribute to preselect an option in the dynamic filter options.
showAllOption
Determines whether or not to show an option to show all data without filter. Use true or false.
filterAdditionalCharts
This attribute is deprecated. See “Use one filter for multiple charts” below.
options (static filter)
Array of filter options. The “f” is the friendly name for the option and the “v” is the database value. Use “*” as “v” attribute to retrieve all items unfiltered. Add “selected”: true if the option should be preselected.
Use one filter for multiple charts
Check the “Create filter(s) above the chart” in the second chart, and insert this in the filter textarea:
{"master":"parent_chart_id"}
Replace “parent_chart_id” with the Chart ID of the chart where you have defined the filter.
Using a script to generate the filter options
Please note that this is for advanced users.
If you want to generate the filter options by a custom script, you can use two different methods.
Option #1 (recommended)
Leave the “options” as an empty array like this:
"options": []
And use a script like this to build the options:
function getFilterOptions(chartId,key,ticker){
 if($("#"+chartId+"_chartfilter_"+key).length === 0){
 // Chart not ready - waiting
 setTimeout(function(){
 if(ticker === undefined){
 ticker = 0;
 }else{
 ticker += 1;
 }
 if(ticker > 60){
 return;
 }
 getFilterOptions(chartId,key,ticker);
 },1000);
 return;
 }
 var optArr = ["<option value='*'>Show all</option>"], year = 2010, thisYear = new Date().getFullYear();
 while(year <= thisYear){
 optArr.push("<option value='"+year+"'>"+year+"</option>");
 year += 1;
 }
 $("#"+chartId+"_chartfilter_"+key).append(optArr.join(""));
}
getFilterOptions("Chart ID","Filter Key");
Change the “Chart ID” with the ID of your chart, and the “Filter Key” to whatever the “key” is in your filter setup. If you look at my example above, the function call would be:
getFilterOptions("SPJS_Charts_v6_Chart_1","Year");
In this code example I have set the start year to 2010 in the function. This function can be used as a starting point for your own filter function.
This script must either be added to a Script editor web part in the page, or you can use the “Load external JS or CSS” tab to link to the file if you have stored it in a document library in your site.
Option #2:
Use a script to generate a Javascript array on the same format as the “options” from my filter example above. Then use this variable name in the “options” part of the filter like this:
"options":{var:YourVariableName}
Use custom CAML
For most users, using an existing list view as source is recommended, but you can use your own custom CAML query if you like.
How to write the CAML is not covered here. You find a lot of information on how to build a CAML query online, but a good tip is to build a view with the filter you want to use, and use this as a starting point by selecting the view in the “Basic setup” and then click the “Get CAML from selected view” button below the filter textarea.
Consume filter from list view web part
Select the checkbox “Consume filter from list view web part” to let the filter on the columns in a list view filter the chart. This requires the chart to be in a page with only one list view. You must have CAML query as a basic filter in the Custom CAML textarea, and you should use the one from the view you are filtering from (use “Get CAML from selected view”).
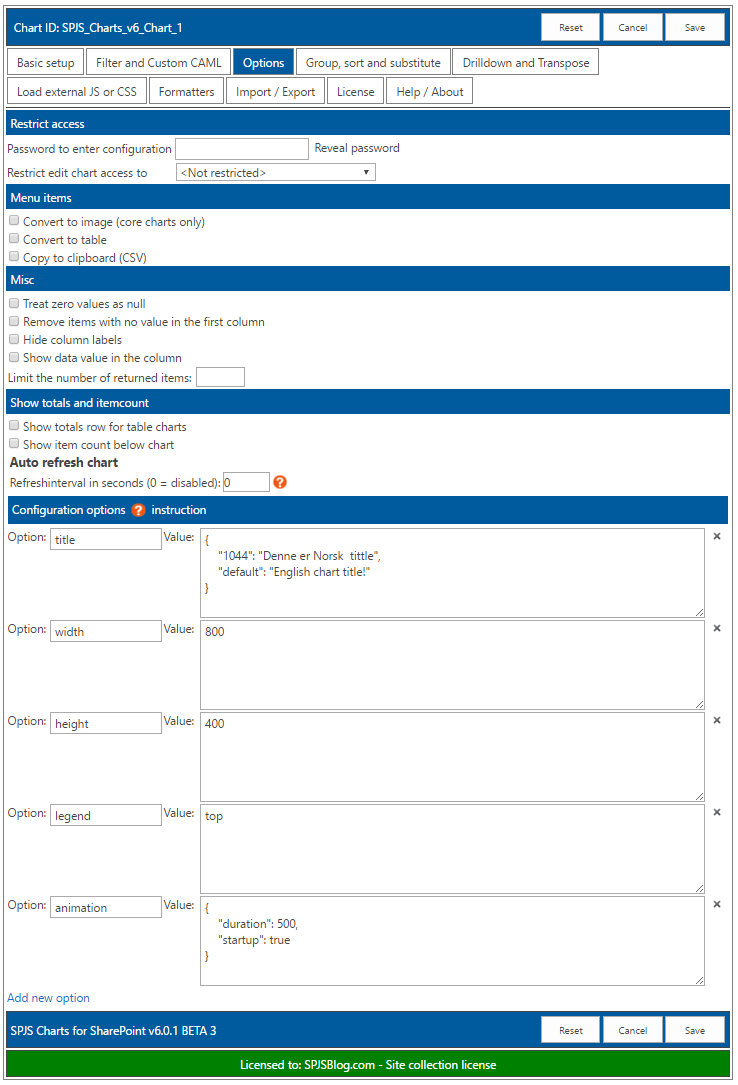
Options
You find information about the different options by following the “instructions” link in the “Configuration options” header.
Color the bar / column based on label
There is one option that is not part of the Google API that lets you set the color of the bar in a chart by the label in the legend.
For a chart showing the status of a task you can use it by adding this options to the “Options” tab for the chart:
Option
colorByLabel
Value
{"In Progress":"yellow","Not Started":"red","Completed":"green"}
Group, sort and substitute
Basic grouping
Use the “Group by first column” to group on for example the”Status” in a tasks list.
Modifier when grouping on a date column
If you use a date column as the first column in your chart, you can select to show either “Month”, “Quarter”, “Year-Month” or “Year-Quarter”.
When using “Group by fort column”, the default method for summing up the other columns is “Sum”. You can also select “Average”, “Count”, “Min” or “Max”.
Advanced grouping
Refer the Google Chart API for details.
Basic sorting
Sort by first column
Sort alfabetically by the first column.
Sort descending
Check this box to sort descending.
Advanced sorting
Refer the Google Chart API for details.
Substitute string values in datatable
Example of basic string substitute
{
 "North": "Department North",
 "South": "Department South"
}
Example of advanced string substitute
Here is all available options used for the “advancedSubstitute” feature. You will most likely not use all on the same column index – this is just an example.
{
 "advancedSubstitute": [
 {
 "index": 0,
 "action": "split",
 "separator": ".",
 "part": 0
 },
 {
 "index": 0,
 "action": "replace",
 "searchvalue": "abc",
 "newvalue": "123"
 },
 {
 "index": 0,
 "action": "prefix",
 "value": "Total "
 },
 {
 "index": 0,
 "action": "suffix",
 "value": " %"
 }
 ]
}
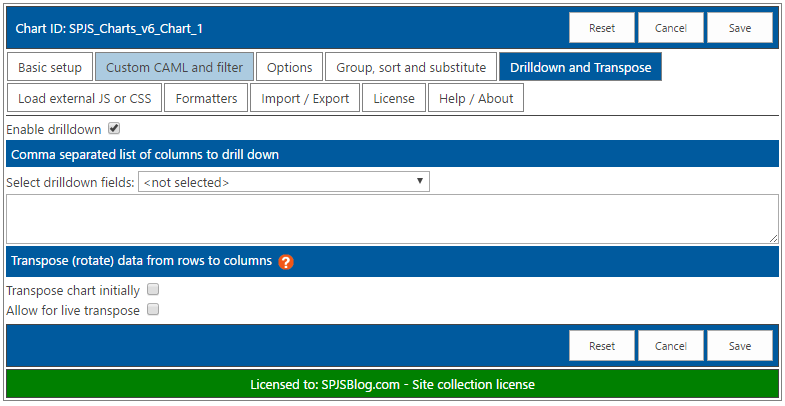
Drilldown and transpose
Drilldown
Use the dropdown to select which columns to drill down on.
Transpose
Use transpose to rotate the chart from rows to columns.
Load external JS or CSS
Use this to for example load an external file with some custom filter functions.
Formatters
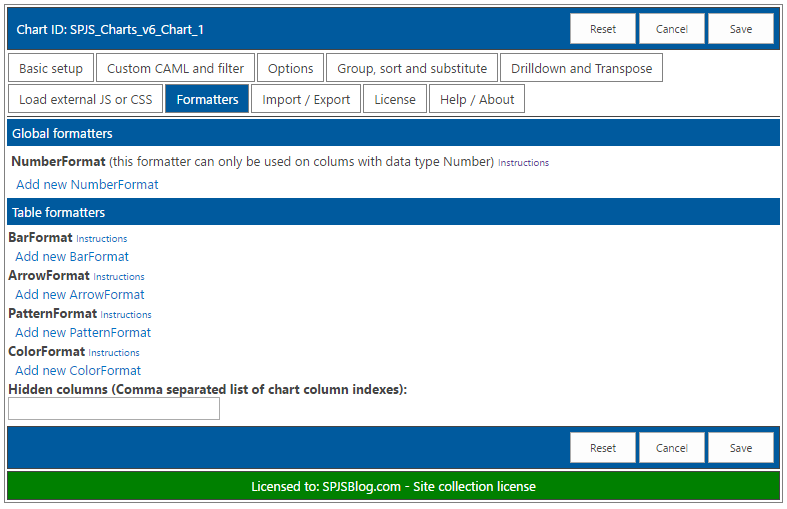
Refer the Google Chart API for details.
Import / Export
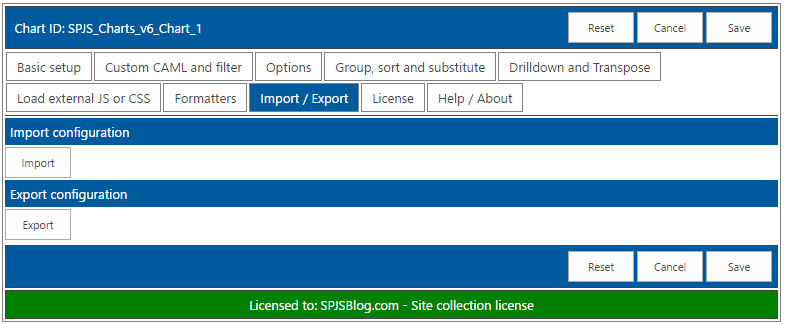
Use this tab to either import an existing chart, or to export the current chart.
If you click the “Import” button, you can import from both v5 and v6 charts, but v4 cannot be imported – they must be manually reconfigured.
License
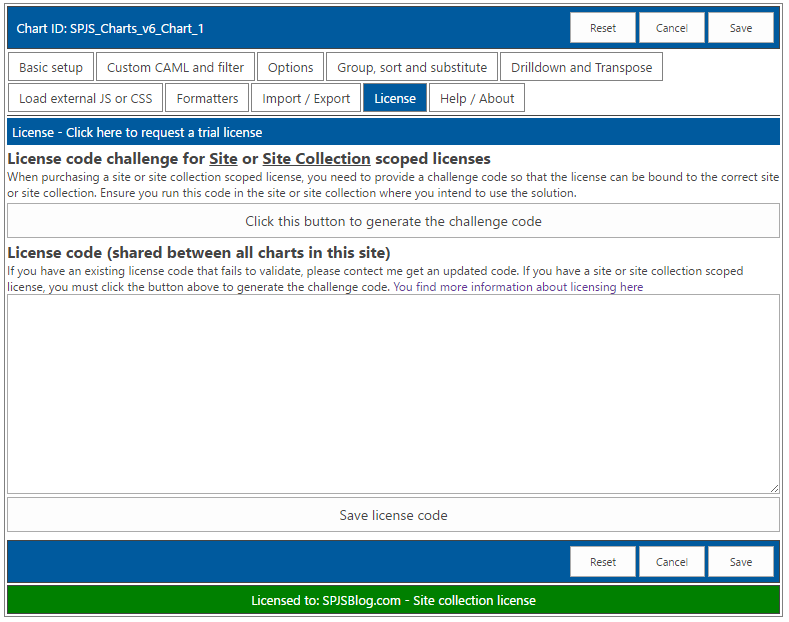
See more details about license codes in a separate section below.
Help / About
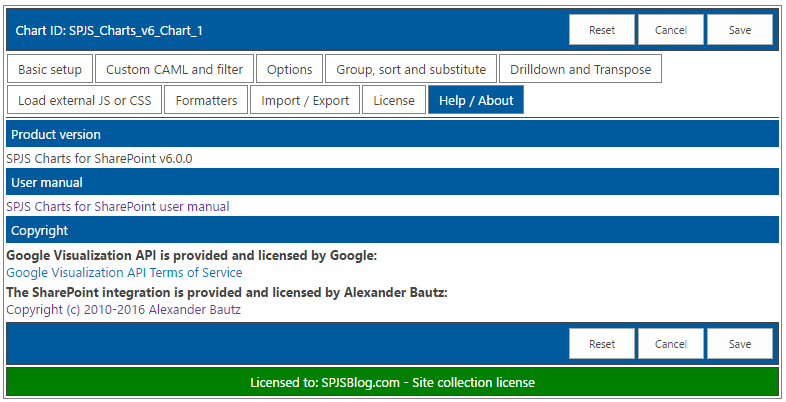
Here you find the product version and link to this user manual.
License code
Please note that this license is shared between all charts in the current site. This means you only have to add this once in each site.
How is the license code validated?
There is no “phone home” to validate any of the license types. This is done locally (in the SPJS Charts script itself).
This is true also for the site collection scoped license where the validation is performed based on the unique Site Collection ID.
Buy the license first
If you don’t already have a valid license you want to upgrade, you must buy a license first. Then generate and send the challenge codes to the address you find in the page where you generate the code.
License code challenge for site or site collection
This step in used only for site or site collection scoped licenses. If you have a Company license of any sort, this step is not used and you can paste the license code you got when you purchased SPJS Charts directly in the “License code” textarea.
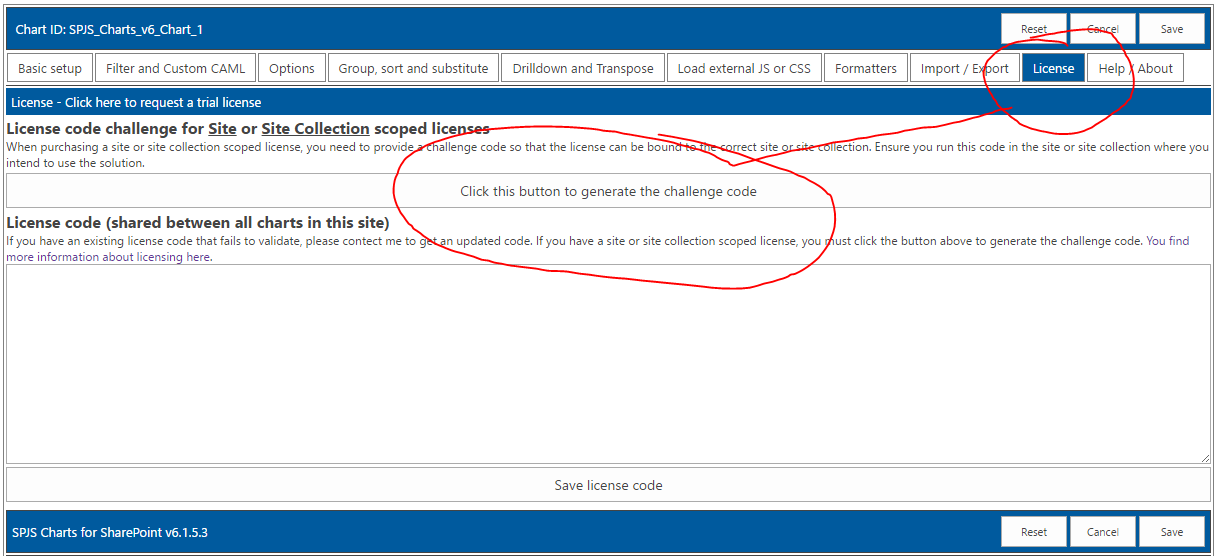
When you have installed SPJS Charts, enter edit mode for one for the charts and open the “License” tab. There you will find a button named “Click this button to generate the challenge code”.
You must send both the SITE and SITE COLLECTION challenge codes.
What is the challenge code created from?
This code is a “hash” of the unique site or site collection GUID and doesn’t reveal any information about your site – it is a string with random numbers and characters like this example:
{2ffe3700-2831-4fb9-a029-9616b9f79b82}
Why is this necessary?
This challenge-response-routine is used to ensure this license is not used in more than one site or site collection (depending on the license type).
Manage the license code centrally
If you have a site collection license (NOT SITE LICENSE) or higher and load the files from the root of the site collection, your can add the license code centrally to have it automatically loaded in all sites using the same instance of the SPJSCharts_loader.
Open the file “/SPJS/DFFS/SPJSCharts_loader.html” and add your license code in this variable in the top of the file:
var spjscharts_master_licensecode = "";
MUI
In most of the places you can add text in the chart configuration, you can use a JSON formatted string like this:
{"1044":"Norwegian text", "1031":"German text", "default":"Fallback text for all languages not specified"}
Using variables in CAML Query and filter
Access user profile (SP server only)
{userProfile:key}
Access user info (current site collection)
{userInfo:key}
Chart filter (from chart filter config)
{filter:key}
URL
{url:key}
JavaScript variable in Custom CAML
<Where><Eq><FieldRef Name='YourColumnName' /><Value Type='Text'>{var:YourVariableName}</Value></Eq></Where>
JavaScript variable in chart filter
This example shows how you can use a variable in teh chart filter. “myCustomFilterOptions” is a JavaScript variable present in a CEWP in the page – accessible to the chart.
"label": "FilterLabel",
"key": "FilterKey",
"multiselect": false,
"size": 3,
"filterAdditionalCharts": [],
"options": {var:myCustomFilterOptions}
You find an article describing how to construct this kind of variable here, but please note that this is for an older version, so you must skip to “Step 2“.
Attaching an event handler
You can use this code to attach a select event handler to a chart
attachSPJSChartsSelectHandler("Put the chart ID here");

function attachSPJSChartsSelectHandler(id){
 try{
 google.visualization.events.addListener(spjs.charts.data.charts[id], 'select', function(e){
 var selection = spjs.charts.data.charts[id].getSelection();
 var data = spjs.charts.data.chartData[id];
 var message = '';
 for (var i = 0; i < selection.length; i++) {
 var item = selection[i];
 if (item.row != null && item.column != null) {
 var str = data.getFormattedValue(item.row, item.column);
 message += '{row:' + item.row + ',column:' + item.column + '} = ' + str + '\n';
 } else if (item.row != null) {
 var str = data.getFormattedValue(item.row, 0);
 message += '{row:' + item.row + ', column:none}; value (col 0) = ' + str + '\n';
 } else if (item.column != null) {
 var str = data.getFormattedValue(0, item.column);
 message += '{row:none, column:' + item.column + '}; value (row 0) = ' + str + '\n';
 }
 }
 if (message == '') {
 message = 'nothing';
 }
 alert('You selected ' + message);
 });
 }catch(ignore){
 setTimeout(function(){
 attachSPJSChartsSelectHandler(id);
 },1000);
 }
}
Currently the default “ready” event cannot be attached, but this code should give you a ready event:
attachSPJSChartsReadyHandler("Put the chart ID here");

function attachSPJSChartsReadyHandler(id){
 try{
 if(spjs.charts.data.charts[id].draw !== undefined){
 alert("The chart with id "+id+" is ready");
 }else{
 setTimeout(function(){
 attachSPJSChartsReadyHandler(id);
 },250);
 }
 }catch(ignore){
 setTimeout(function(){
 attachSPJSChartsReadyHandler(id);
 },250);
 }
}
You must replace “Put the chart ID here” with the chart ID of the chart you want to attach the event to.
Refer the Google Charts guide for details.
Load charts manually
If you for any reason needs to control when a chart is drawn, you can add a variable to the page like this:
var spjs_charts_load_manually = true;
With this variable in the page, the chart will not render until you call it manually like this:
spjs.charts.init_man("your_chart_id);
In v6.1.5.6 I have added an example file “loadChartsFromDropdown.html” to the root of the “Charts_v6” folder. This file shows you how to add multiple charts to a page – like a dashboard – and load each chart manually by selecting it from a dropdown menu.
Create chart from custom datasource (SPJS Charts v7)
In SPJS Charts v7 you can select between using a regular SharePoint list or a custom function as datasource.
You can use a custom datasource if you for example need to combine the data from two lists, or you have a fixed dataset you want to paste directly into the chart configuration.
You find an article describing the setup of a custom datasource here: https://spjsblog.com/spjs-charts-for-sharepoint/spjs-charts-custom-datasource/
