› Forums › SPJS Charts for SharePoint › How to display Yes/No string column counts in chart? › Reply To: How to display Yes/No string column counts in chart?
April 5, 2020 at 10:07
#29353
Participant
Hi Alexander,
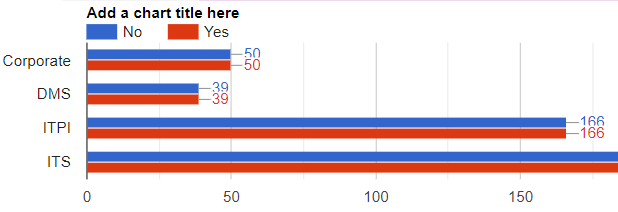
The Yes/No is showing the same amounts. (file attached)
In the Group, sort and substitute tab:
Group by first column is ticked.
Aggregation function for all columns = Count.
Do I need to specificy an advanced grouping array?
Also, is there a preferred method to display the count as a percentages in a pie chart?
Thanks for your time.