27.09.2012 v3.3.6 includes these changes:
- Changed the method for caching the filter values when loading the charts and changing the filter dropdowns. This should fix any errors when you have multiple filtered charts in one page.
- Added option to override “chart options” set in the GUI by adding an object to the CEWP like this:
var chartOptionOverride = {"MyChart1":{"title":"This is the chart title!"}};
See the CEWP code example for v3.3.6 in the download section
In v3.3.5 I have added these features:
- Changed the way the chart and the accessories are rendered to keep all items within the “chart container”. This helps in positioning the charts in the page.
- Added option to load the chart manually.
- Added option to display a placeholder / overlay when the chart is loading. This will prevent the page from looking like it has frozen while loading a heavy chart. The page is still unresponsive – but at least it looks better.
What happens under the hood is that the chart is created in a separate container – dynamically created within the container defined in the CEWP. For those interested, this container is named containerId_chart. Where “containerId” is the id defined in the array “arrOfChartContainers” in the CEWP.
You can delay the loading of the chart by 4000ms (4 seconds) like this:
<div id="MyChart1"></div>
<script type="text/javascript">
/*****************************************************
		Address all containers
*****************************************************/
// All charts must be represented by a container with a unique id.
// This container  must be present in the page
var arrOfChartContainers = ["MyChart1"];
var loadRC = false;
var allowEval = false;

var loadManually = true;
function manualLoad(){
	loadManually = false;
	spjs_GenerateChart();
}

setTimeout(function(){
	manualLoad();
},4000);

</script>
<script type="text/javascript" src="https://ajax.googleapis.com/ajax/libs/jquery/1.7.2/jquery.min.js"></script>
<script type="text/javascript" src="https://www.google.com/jsapi"></script>
<script type="text/javascript" src="/test/English/Charts/Javascript/3.3/SPJS_ChartsForSharePoint_v3.3.5.js"></script>
Or you can make a button and call the chart manually like this:
<input type="button" onclick="manualLoad()" value="Load chart">
<div id="MyChart1"></div>
<script type="text/javascript">
/*****************************************************
		Address all containers
*****************************************************/
// All charts must be represented by a container with a unique id.
// This container  must be present in the page
var arrOfChartContainers = ["MyChart1"];
var loadRC = false;
var allowEval = false;

var loadManually = true;
function manualLoad(){
	loadManually = false;
	spjs_GenerateChart();
}
</script>
<script type="text/javascript" src="https://ajax.googleapis.com/ajax/libs/jquery/1.7.2/jquery.min.js"></script>
<script type="text/javascript" src="https://www.google.com/jsapi"></script>
<script type="text/javascript" src="/test/English/Charts/Javascript/3.3/SPJS_ChartsForSharePoint_v3.3.5.js"></script>
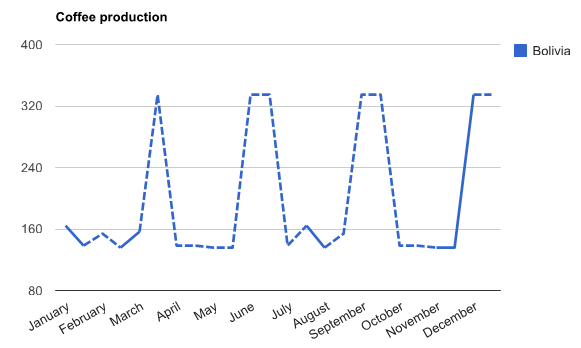
To have a placeholder like this while the chart loads:
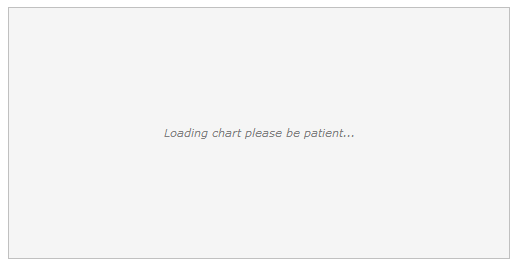
You must add this code to your CEWP:
<style type="text/css">
.chartLoadingOverlay{
	font-style:italic;
	color:gray;
	border:1px silver solid;
	background-color:#F5F5F5;
	line-height:250px;
	height:250px;
	width:500px;
	text-align:center;
	margin:2px;
}
</style>

<div id="MyChart1"></div>
<script type="text/javascript">
/*****************************************************
		Address all containers
*****************************************************/
// All charts must be represented by a container with a unique id.
// This container  must be present in the page
var arrOfChartContainers = ["MyChart1"];
var loadRC = false;
var allowEval = false;

var loadManually = true;
function manualLoad(){
	loadManually = false;
	spjs_GenerateChart();
}
</script>
<script type="text/javascript" src="https://ajax.googleapis.com/ajax/libs/jquery/1.7.2/jquery.min.js"></script>
<script type="text/javascript" src="https://www.google.com/jsapi"></script>
<script type="text/javascript" src="/test/English/Charts/Javascript/3.3/SPJS_ChartsForSharePoint_v3.3.5.js"></script>
<script type="text/javascript">

$.each(arrOfChartContainers,function(i,id){
	$("#"+id).html("<div class='chartLoadingOverlay'>Loading chart please be patient...</div>");
});
setTimeout(function(){
	manualLoad();
},100);
</script>
The setTimeout is necessary to let the browser render the overlay before it freezes while retrieving the data for the chart.
Please note the these features require v3.3.5 of SPJS Charts for SharePoint.
You find the files, and additional information in this article
Alexander