Category Archives: Charts

Charts for SharePoint v5 is finally here

SPJS Charts for SharePoint v6 can be found here

I published the first version of the SPJS Charts for SharePoint back in 2010, and released the current v4 version well over 2 years ago.

After being neglected for far to long, I’m happy to finally release v5 of SPJS Charts for SharePoint in a BETA version.

Charts_v5_config

This version has been brushed up quite a lot, and supports most of the chart types available in the Google chart solution.

I have also added support for basic drill-down, transpose and a few other new features. It still supports all SharePoint versions, but I have not been able to test it in SP 2007 – feedback is appreciated.

This new version will not interfere with v4 of SPJS Charts for SharePoint (uses a separate configuration list), but you cannot use v4 and v5 in the same page. You cannot currently import existing charts from v4, but this might be added as an option if there is demand for it.

There is no trial period built in, but you can request a 1-3 month trial by following the link in the banner below the chart.

Follow these simple steps to install

  1. Download the files form here
  2. Unzip, and upload to a document library named “SPJS”. The folder structure should be “/SPJS/Charts/”.
  3. Edit the file “SPJSChartsMaster_CEWP.html” to correct all the links to the various scripts.
  4. Copy the path to the file “SPJSChartsMaster_CEWP.html” and insert the link in the Content link field in a Content Editor Web Part (CEWP) in a page in your site.

Localize the frontend UI

You can edit the file “/SPJS/Charts/js/spjs-charts-i18n.js” to add your own translation for the labels and messages in the frontend UI.

User manual

The user manual is not yet complete, but you find it here.

Feedback and comments

Please post any feedback in the forum

SPJS Poll for SharePoint v2.0

I have brushed up the 5 year old solution Poll for SharePoint, to change the deprecated “Google Image Charts to use Google Charts (AKA Google Visualization). The Image Charts are officially deprecated, but will probably continue working for some time, but to ensure you have a working solution, you should upgrade to this new version.

Please note that there are some changes to the Content Editor Web Part code, so existing users must not only update the script file, but also look over the CEWP code and make some small changes.

This code lets you generate polls without the need for server side installed WebParts.
Change log
March 15, 2015
v2.0 released. This one has no new functionality, but the code has been brushed up, and now the charts are generated using “Google Charts” rather than “Image Charts”.
Poll

IMG

Result with column chart

IMG

How to set it up
Create a custom list with the following fields
  • Answer: Single line of text
  • Question: Single line of text

Name it anything you like, but keep the display name fairly simple (no special characters) as you will use the display name in the CEWP code.

CEWP code

The CEWP code below refers jQuery from Google. If you have a local copy of jQuery you can change the script src. You find the code for the file “SPJS-Poll.js” at the bottom of the page.

NOTE: You must change the script src for the file “SPJS-Poll.js” and “spjs-utility.js” to point your instance of the files – the CEWP code will not work unless you do this.
Place this code where you want the poll to appear:
<div id="SPJS_Poll"></div>
<link type="text/css" href="/Scripts/Poll/spjs_poll.css" rel="stylesheet">
<script type="text/javascript" src="https://www.google.com/jsapi"></script>
<script type="text/javascript" src="https://code.jquery.com/jquery-1.11.2.min.js"></script>
<script type="text/javascript" src="/Scripts/spjs-utility/spjs-utility.js"></script>
<script type="text/javascript" src="/Scripts/Poll/SPJS-Poll.js"></script>
<script type="text/javascript">

// Preload the chart solution
google.load("visualization", "1", {"packages":["corechart","table"]});

// If you want to override these texts, uncomment the object and localize as you like.
/* 
	spjs.poll.text = {
		"submitLinkText":"Submit",
		"backLinkText":"Back",
		"showResultBtnText":"Show result",
		"pollNotActiveText":"The poll is not active prior to {0}",
		"pollEndedText":"The poll ended on {0}",
		"alreadyRespondedText":"You answered: ",
		"totalResponsesLabel":"Total responses: ",
		"chartLegendLabels":["Answer","Count"]

	};
*/

spjs.poll.init({pollAnswerListName:'Poll',
				listBaseUrl:L_Menu_BaseUrl,				
				id:"Poll_3", // Allowed characters id a-z, 0-9 - and _
				start:"01/02/2015", // format: mm/dd/yyyy
				end:"03/15/2015", // format: mm/dd/yyyy
				singleResponse:false,
				q:"What is your favorite junk food?",
				qStyle:"font-size:1.5em;color:#444;",
				aStyle:"font-size:xx-small",
				a:["Pizza","Hot dog","Hamburger","Neither of them"], // Leave empty for free input				
				color:["red","green","blue","orange"],
				forceLowerCaseAnswer:false, // Group result by lowercase				
				chart:"col", // table, bar, col or pie
				height:200,
				width:500});

</script>

Object attributes explained

  • pollAnswerListName: DisplayName or GUID of the list that stores the answers
  • listBaseUrl: The baseUrl of the site. This is like “/sites/hr” when the list is located in the site “hr” under “/sites”. Use L_Menu_BaseUrl (or omit the property) for current site.
  • id: The unique id of the poll. All poll answers are stored in a list and this id is used to separate each poll
  • start: Start date in the format mm/dd/yyyy
  • end: End date in the format mm/dd/yyyy
  • singleResponse: true for one reply per user, false for unlimited number of replies
  • q: Poll question. To have a linefeed in the question, use <br>
  • qStyle: CSS syntax style
  • aStyle: CSS syntax style
  • a: Answers in an array format. To use free input and not predefined answers, leave the array empty.
  • color: Colors for the chart in an array format. This must have the same length as the previous parameter – one color for each answer
  • forceLowerCaseAnswer: Primarily for use with free input to avoid getting two “series” when the only difference are uppercase characters.
  • chart: “bar” for bar chart, “col” for column chart, “pie” for pie chart or “table” for a plain table.
  • height: Height in pixels
  • width: Width in pixels
Regarding free input

If you leave the attribute “a” as an empty array, the user can supply free text as “answer”. When using free input, the result are automatically presented as a table.

Download code

The code for the file SPJS-Poll.js. You find spjs-utility.js here.

Questions or feedback

Post any questions in the forum

Alexander

Build a Site Map for SPJS Charts for SharePoint

Change log
January 1. 2014
v1.2 has these changes:
Fixed bug where the string representing the “tile” in the org chart exceeds 255 characters and thus halting the script. This is fixes by using a multiline text field in stead of the Title field in the list “SPJS-SiteMap”.

You find the updated code below.

Updating from a previous version?
Please note that you must delete the existing list and rerun the script to recreate it with the new fields. When the script has recreated the list, you must enter setup of your chart to reselect the list and fields for your SiteMap chart. See image below for changes in the chart setup (new field used in stead of the Title field).

I got a request from Stacy Draper ‏@stacyDraper on Twitter:

@SPJavaScripts do you have something that makes a site map? Using the logged in perms instead of having to be a site col admin would be nice

Unfortunately I do not know of a method of doing this without Site collection Administrator (SCA) rights, but thought I should post a solution anyways. This solution iterates trough all sites in the site collection and writes to a custom list in a format that can be rendered as a clickable organization chart using SPJS Charts for SharePoint.
IMG
The map must be created or updates by a SCA, but can be read by all users.

How to set it up
  1. Set up SPJS Charts for SharePoint v4 as described here. Please note that you need v4.03 or later.
  2. Download spjs-utility.js from here and save it in a document library or a folder created in SPD.
  3. Create a Web Part Page and add a HTML Form Web part to it. Add the code from the code block below in the source editor.

    You can also use a CEWP if you use the content link option to link to the code. Do not add the code directly in the source editor of the CEWP.

  4. Download jQuery from here.

When you reload the page, you will see a button named “Add or update site map”. Click this to set up the list. You should get a confirmation message when the list has been created. You need appropriate permissions to add a list. If you are a SCA, go ahead and populate the list with information about all sites in the site collection. This is done by clicking the same button again.

You will get a confirmation message with the count of items added, updated and removed. The information in the list SPJS-SiteMap is now static and will not reflect changes in the site structure live. To update the site map when a site has been added / updated or removed, an SCA must click the button “Add or update site map” again.

Code

You must update the script src to point to your local files.

<div id="siteMapBtn"></div>
<script type="text/javascript" src="/Scripts/jquery-1.10.2.min.js"></script>
<script type="text/javascript" src="/Scripts/spjs-utility/spjs-utility.js"></script>
<script type="text/javascript">

var spjs = spjs || {};

spjs.siteMap = {
	"version":"1.2",
	"data":{
		"listName":"SPJS-SiteMap",
		"listBaseUrl":typeof _spPageContextInfo !== "undefined" ? _spPageContextInfo.siteServerRelativeUrl !== "/" ? _spPageContextInfo.siteServerRelativeUrl : "" : L_Menu_BaseUrl,
		"listDescription":"SPJS-SiteMap for SharePoint by Alexander Bautz / SharePoint JavaScripts: https://spjsblog.com. This list is used as datasource for SPJS Charts for SharePoint."
	},
	"showButton":function(){
		$("#siteMapBtn").html("<input type='button' onclick='spjs.siteMap.update()' value='Add or update site map' />");
	},
	"update":function(){		
		if(!confirm("You must be Site Collection Administrator to add or update the site map. Click OK to continue.")){
			return;
		}
		var b, webs, thisBaseUrl, p, currItems, currItemsObj, newList, uList, data, res, noChangeCount, uCount, nCount, dCount, error;
		b = '<GetAllSubWebCollection xmlns="http://schemas.microsoft.com/sharepoint/soap/" />';
		webs = {};
		spjs_wrapSoapRequest(spjs.siteMap.data.listBaseUrl+'/_vti_bin/webs.asmx', 'http://schemas.microsoft.com/sharepoint/soap/GetAllSubWebCollection', b, function(data){
			$('Web', data).each(function(i,o){
				thisBaseUrl = $(o).attr("Url").replace(location.protocol+"//"+location.host,"");
				if(thisBaseUrl === ""){
					thisBaseUrl = "/";
				}
				p = $(o).attr("Url").replace(location.protocol+"//"+location.host,"");
				p = p.substring(0,p.lastIndexOf("/"));
				if(p === ""){
					p = "/";		
				}
				webs[thisBaseUrl] = {"title":$(o).attr("Title"),"parent":p};
			});
		});
		// Get current items
		currItems = spjs_QueryItems({"listName":spjs.siteMap.data.listName,"listBaseUrl":spjs.siteMap.data.listBaseUrl,"query":"<Where><IsNotNull><FieldRef Name='ID' /></IsNotNull></Where>","viewFields":["ID","CurrentSite","Parent","URL"]});
		if(currItems.count === -1){
			if(confirm("It looks like the list named "+spjs.siteMap.data.listName+" does not exist.\n\nCreate it now?")){
				newList = spjs_AddList(spjs.siteMap.data.listName,spjs.siteMap.data.listBaseUrl,spjs.siteMap.data.listDescription);
				if(newList.success){
					uList = spjs_UpdateList(newList.id,L_Menu_BaseUrl,[{'Type':'Note','DisplayName':'CurrentSite'},{'Type':'Note','DisplayName':'Parent'},{'Type':'Note','DisplayName':'URL'}],[]);
					if(!uList.success){						
						alert(uList.errorText);
						return;
					}else{
						if(confirm("The list was created successfully. Click OK to populate the list.")){
							spjs.siteMap.update();
						}
					}										
				}else{
					alert("[spjs_AddList]\n\n"+newList.errorText);
					return;
				}
				return;
			}else{
				return;
			}
		}
		currItemsObj = {};
		noChangeCount = 0;
		uCount = 0;
		nCount = 0;
		dCount = 0;
		$.each(currItems.items,function(i,item){
			currItemsObj[item.URL === null ? "" : item.URL] = {"ID":item.ID,"CurrentSite":item.CurrentSite,"Parent":item.Parent,"URL":item.URL};
		});
		error = false;
		$.each(webs,function(url,o){
			data = {"Title":"[...]","CurrentSite":"{\"v\":\""+url+"\",\"f\":\"<a href='"+url+"' target='_blank'>"+o.title+"</a>\"}","URL":url,"Parent":o.parent}
			if(currItemsObj[url] !== undefined){			
				if(currItemsObj[url].CurrentSite === data.CurrentSite && currItemsObj[url].Parent === o.parent && currItemsObj[url].URL === url){
					delete currItemsObj[url];
					noChangeCount += 1;
					return;
				}	
				res = spjs_updateItem({"listName":spjs.siteMap.data.listName,"listBaseUrl":spjs.siteMap.data.listBaseUrl,"id":currItemsObj[url].ID,"data":data});
				delete currItemsObj[url];
				if(!res.success){
					error = {"errorText":res.errorText,"code":res.errorCode};
					return false;
				}else{
					uCount += 1;
				}
			}else{
				res = spjs_addItem({"listName":spjs.siteMap.data.listName,"listBaseUrl":spjs.siteMap.data.listBaseUrl,"data":data});
				if(!res.success){
					error = {"errorText":res.errorText,"code":res.errorCode};
					return false;
				}else{
					nCount += 1;
				}
			}				
		});	
		if(error !== false){
			alert("SPJS-SiteMap: An error occurred\n---------------------------------------\nAre you updating from a previous version? If the below error message tells you that one or more field types are not installed correctly, please delete the list \"SPJS-SiteMap\" and rerun this script. The list will be recreated with the missing fields.\n\nPlease note that you must edit the SiteMap chart to reselect the list and fields.\n\nError message\n---------------------------------------\n"+error.errorText);
		}	
		$.each(currItemsObj,function(url,obj){
			res = spjs_deleteItem({"listName":spjs.siteMap.data.listName,"listBaseUrl":spjs.siteMap.data.listBaseUrl,"id":obj.ID});
			if(!res.success){
				alert("[spjs.siteMap]\n\n"+res.errorText);
				return false;
			}else{
				dCount += 1;
			}
		});
		alert("SPJS-SiteMap\n\nUpdated: "+uCount+"\nAdded: "+nCount+"\nRemoved: "+dCount);
		location.href = location.href;
	}
};

spjs.siteMap.showButton();
</script>
How to configure the chart

Refer the SPJS Charts for SharePoint v4 article for setup instructions, and select the list “SPJS-SiteMap” as data source. Add an option “allowHtml = true” to render the links as HTML. Here is a screenshot of the Edit Chart GUI:
IMG

Let me know what you think of this solution in the comments section below.

Alexander

SPJS Charts for SharePoint: date range filter

In this article I will show you how to add a date range filter to a chart created using SPJS Charts for SharePoint v4. The code demonstrated below will query the list and get the highest and lowest date in the field specified in the query. It will then create the filter dropdowns based on the interval you select. Currently you can use “m” for month, or “y” for year.

IMG

How to set it up

To use this method for filtering a chart, you must set the variable “allowEval” to true in the CEWP code like this:

// Set this to true to allow for the use of variables in the "Filter setup textarea"
var allowEval = true;

Then you add this code to the same CEWP:

function spjs_getDateRangeFilter(list,field,interval,format){
	var q, res, start, end, split, startDate, endDate, b, d, m, y;
	// Find the start date
	q = "<Where><IsNotNull><FieldRef Name='"+field+"' /></IsNotNull></Where><OrderBy><FieldRef Name='"+field+"' Ascending='TRUE' /></OrderBy>";
	res = spjs.charts.qItems({"listName":list,"query":q,"viewFields":[field],"rowLimit":1});
	start = res.items[0][field];
	// Find the end date
	q = "<Where><IsNotNull><FieldRef Name='ID' /></IsNotNull></Where><OrderBy><FieldRef Name='"+field+"' Ascending='FALSE' /></OrderBy>";
	res = spjs.charts.qItems({"listName":list,"query":q,"viewFields":[field],"rowLimit":1});
	end = res.items[0][field];
	split = start.split(/-| |:/);
	startDate = new Date(split[0],parseInt(split[1],10)-1,split[2]);	
	split = end.split(/-| |:/);
	endDate = new Date(split[0],parseInt(split[1],10)-1,split[2]);
	b = [];
	switch(interval){
		case "m":	
			endDate.setMonth(endDate.getMonth()+1);					
		break;		
		case "y":
			endDate.setFullYear(endDate.getFullYear()+1);
		break;
		default:
			alert("The interval \""+interval+"\" is not supported. Use \"m\" for month or \"y\" for year.");
			return [{"f":"","v":""}];	
	}
	while(startDate<=endDate){
		d = startDate.getDate();
		d = d < 10 ? "0"+d : d;
		m = startDate.getMonth()+1;
		m = m < 10 ? "0"+m : m;
		y = startDate.getFullYear();
		b.push({"f":format.replace("yyyy",y).replace("MM",m).replace("dd",d),"v":String(startDate.getFullYear()+"-"+(startDate.getMonth()+1)+"-"+startDate.getDate()+" 12:00:00")});
		switch(interval){
			case "m":					
				startDate.setMonth(startDate.getMonth()+1);				
			break;		
			case "y":
				startDate.setFullYear(startDate.getFullYear()+1);
			break;		
		}
	}
	return b;
}

var myCustomFilterOptions = spjs_getDateRangeFilter("ListNameOrListGuid","FieldInternalName","m","MM/dd/yyyy");

The variable “myCustomFilterOptions” is used in the filter textarea in the chart. You can name it anything you like, preferably something that identifies the filter.

The arguments to the function “spjs_getDateRangeFilter” is as follows:
list: The DisplayName or the list GUID of the list you are querying.
field: The field internal name of the field – must be type “Date and time”.
interval: The date interval for the filter. Use “m” for month, or “y” for year.
format: The format of the visible date in the dropdown. Use any combination of dd (for day), MM (for month) and yyyy (for year).

Look her to learn how to find the list GUID and the FieldInternaleName.

This is the setup for the chart shown in the top of this article:
IMGIMG

The text in the filter textare is this:

[{"label":"Date from","urlKey":"date1","multiselect":false,"size":5,"options":myCustomFilterOptions},{"label":"Date to","urlKey":"date2","multiselect":false,"size":5,"options":myCustomFilterOptions}]

Please note the name of the variable “myCustomFilterOptions” from the CEWP code.

And the text from the Custom CAML-query textarea is this:

<Where><And><Geq><FieldRef Name='Date' /><Value Type='DateTime'>{filter:date1}</Value></Geq><Leq><FieldRef Name='Date' /><Value Type='DateTime'>{filter:date2}</Value></Leq></And></Where>

You must change the name of the filed to match the FieldInternalName of the field in your list.

Leave a comment below if you like it, or you need help setting it up.

Alexander

SPJS Charts for SharePoint v4

SPJS Charts for SharePoint v5 is finally here

Change log
February 06. 2014
v4.14:
Another fix for scenarios where you have an initial filter that returns data for these columns:
“apples”, “oranges”, “bananas”You then filter the chart and get data in these columns only:
“apples”, “bananas”

You will then get an error
“Invalid column index 3. Should be an integer in the range [0-2]”

January 26. 2014
v4.11:

  • Removed the “pageId” prefix for charts stored in the configuration list. This means you now can rename web part pages containing charts without “loosing the chart”. There will be no problems with existing charts.
  • Bugfix for the following scenario: You have a chart with a filter, and you load the chart initially with a filter that returns no items. You then change the filter and select “all”. You may end up with data plotted in the wrong column / series.
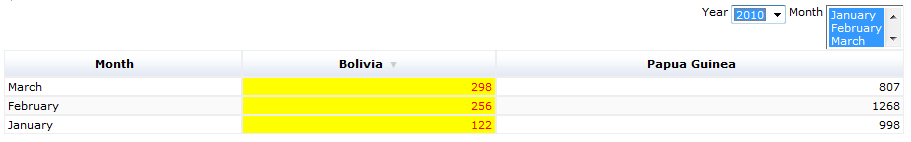
  • Fixed the “Visible columns” for table charts.
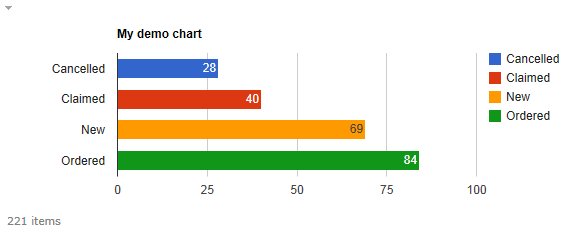
  • Added option to show the data label in the column (you find it under advanced options):
    IMG
  • Minified the code.

December 7. 2013
v4.05:

  • Fixed “Consume filter from list view” where the filter value had & in it.
  • Fixed the L_Menu_BaseUrl override in SP2013 as this came out wrong in the root site.

November 7. 2013
v4.03:

  • Fixed small bug where”No items found” is repeated if you filter the chart and you get 0 items returned two or more consecutive queries.
  • Org chart now supports this format in the first column:
    {"v":"Alexander","f":"Alexander<div style='color:red;font-style:italic;'>SharePoint JavaScripts</div>"}
    

October 8. 2013
v4.01: Fixes small bug with the “Filtering…” overlay when using “filterAdditionalCharts”.

October 5. 2013
Updated the CEWP code for the Master Web Part as some users had problems loading the solution. One of the closing script tags had disappeared from the code, and this is most likely the cause. I have also moved jQuery above the JSAPI as some users fixed the problems this way.

This is v4 of SPJS Charts for SharePoint. You find the previous articles here, but please note that examples and techniques may have changed in v4.

This version, as the previous ones, lets you create charts from data stored in any lists in the site collection, and add them to any SharePoint page. The charts are created using Google Visualization API.

I have redone the script in v4, and added some improvements like support for animations, automatic refresh of the chart when the datasource is updated, and more. You find a full change log below.

This solution is still entirely client side – nothing is installed on the server.
Changelog
  • Major overhaul of the code.
  • Changed how the chart containers are named. Previously you had to name them in the CEWP, but now this is done automatically.
  • Its now much easier to add multiple charts to a page as you do not have to edit the code, just add another web part to the page.
  • Bypassed rowlimit for list views to overcome the “paging limit” when using a SharePoint view (and not Custom CAML).
  • Added timeline chart. Please note that there are some bugs in this charts tooltip in IE 10. Hopefully this will be fixed by Google in the next release.
  • Fixed preselecting multiple filter values.
  • Added support for automatically setting up filter for all single line of text columns, calculated columns, choice columns and single choice people picker columns.
  • Added support for animations when loading and filtering.
  • Added support for auto refresh of the chart when the datasource is updates.
  • The last good configuration is automatically stored. You can revert to this if there are errors in the config preventing you from loading it.
  • Added support for password protection of individual charts.
  • Added support for copying, importing and exporting chart configuration (requires licensed version).
  • Added support for setting the series color by label. Like “In progress” = green, “Deferred” = yellow and “Not started” = red. Click “Custom options” at bottom of the Options sections in Edit Chart GUI for instructions.
  • And lots of small fixes.
Deprecated features
  • The “chartOptionOverride” object has been replaced with the function “spjs_chartOptionOverride”. See details on the new function in a separate post.
  • The “prefix” for “sum”, “count” and “average” has been removed. Use numberformat: prefix in stead.
Upgrading from previous version

This solution is NOT directly compatible with previous versions (1.x, 2.x and 3.x). You must set up a new configuration list and modify all existing chart containers with the new code. When this is done, you can import your chart one-by-one from the old configuration list.

Please note that the import feature require a licensed version of SPJS Charts for SharePoint. Click here to buy a license code to unlock the import / export and copy features.

Why is it not compatible with previous versions?

The reason for not making this version backwards compatible has to do with the completely different way the configuration is stored in the configuration list, and the fact that the chart containers are no longer named in the CEWP code. The chart containers now get their unique id assigned automatically. This is done to make putting multiple charts in one page as easy as adding another web part.

Follow these steps to set up the solution
  1. Download jQuery 1.10.x from here. You can use v1.6.4 and up, but you should stay with the 1.x version as 2.x is NOT compatible with Internet Explorer 6, 7 and 8.
  2. Download spjs-charts-v4.js from here.
  3. Create a document library to hold the scripts. You must ensure all users have read access to this library. You can also create a folder using SharePoint designer.
  4. Upload the files to this library / folder.
  5. Create a text file and add this code – ensure you modify the script “src” for “jquery-1.10.2.min.js” and “spjs-charts-v4.js” to point to the location you put your files:
    <div class="spjs_chartPlaceholder_master"></div>
    <script type="text/javascript">
    // Set this to true to load the Google Visualization API release candidate
    var loadRC = false;
    // Set this to true to allow for the use of variables in the "Filter setup textarea"
    var allowEval = false;
    </script>
    <script type="text/javascript" src="/Scripts/jquery-1.10.2.min.js"></script>
    <script type="text/javascript" src="https://www.google.com/jsapi"></script>
    <script type="text/javascript" src="/Scripts/Charts/spjs-charts-v4.js"></script>
  6. Upload the text file to the same location you put the other files.
  7. Add a CEWP to the page where you want the chart to appear, and use the “Content link” option to link to the text file with the CEWP code from step 5. You can skip step 6 and use a HTML Form Web Part and add the code in the Source editor, but I recommend using the CEWP and content link option to be able to update the code for all charts in one centralized location.
    Please note that you can NOT add the “master code” directly to a CEWP source editor. Either use the content link option in the CEWP to link to a file with the code, or use a HTML form web part. This is necessary because SharePoint messes with the code by appending the script generated contents to the CEWP when you edit the page.
  8. Reload the page and click OK on these two dialogs:
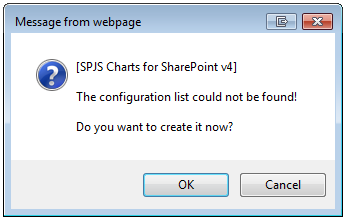
    IMG
    IMG
  9. Finished!

If you want to override the loading animation, the filtering label or the “No items found” label, add these variables to the CEWP code:

var spjs_charts_loadingOverlayLabel = "Loading chart...";
var spjs_charts_filteringLabel = "Filtering, please wait...";
var spjs_charts_noItemsFoundLabel = "No items match this filter...";
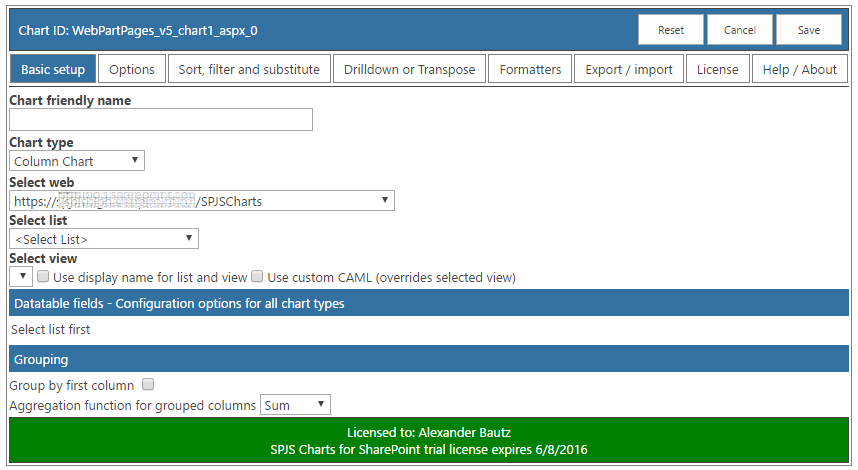
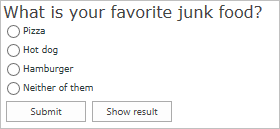
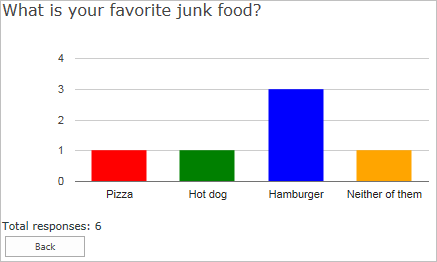
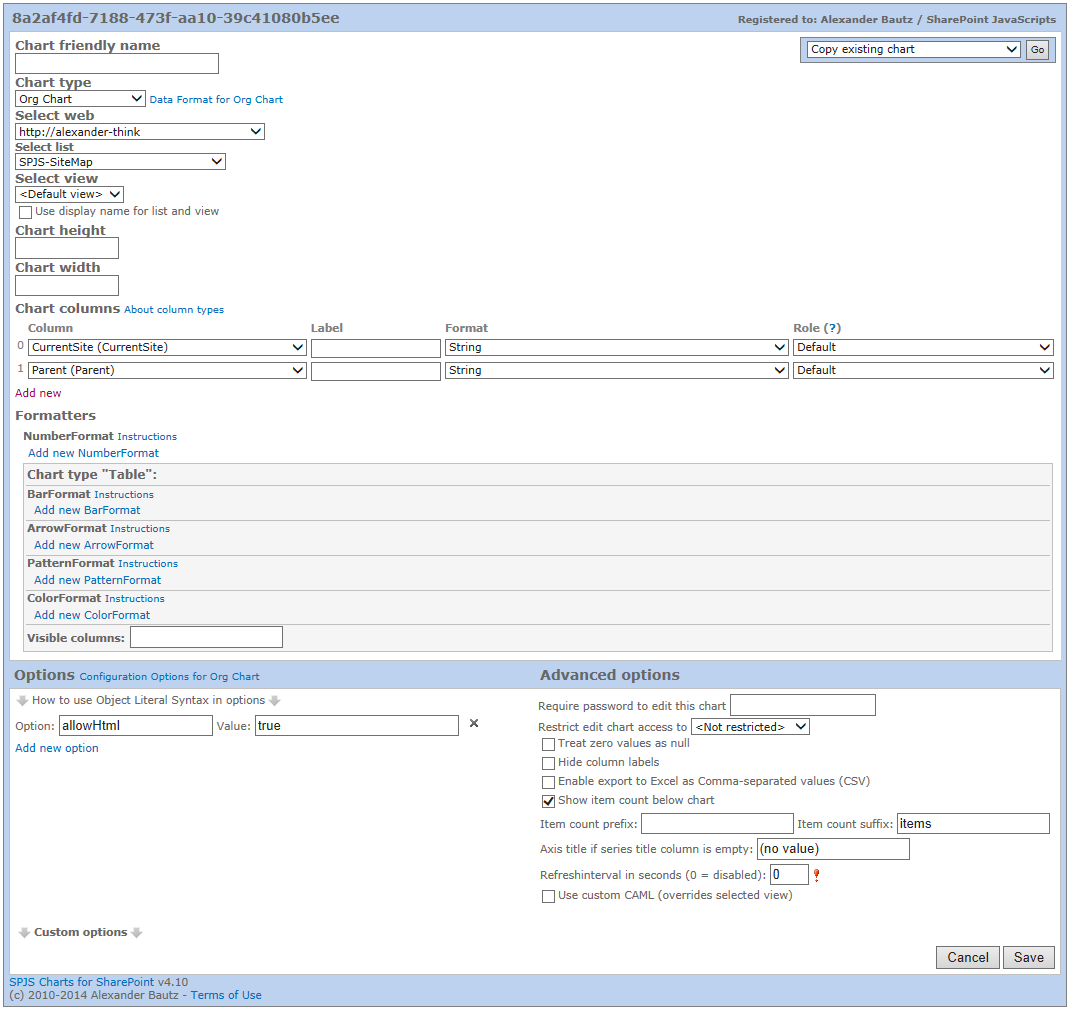
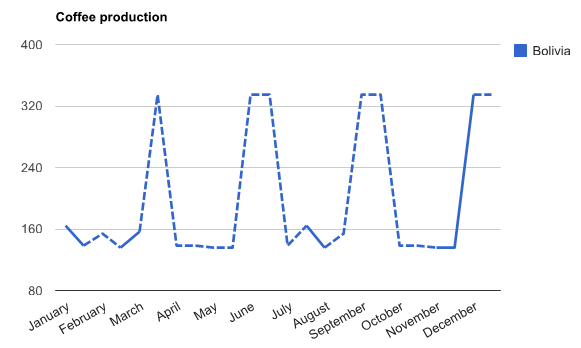
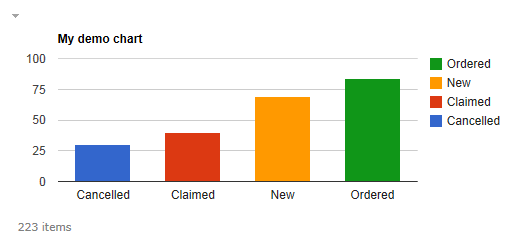
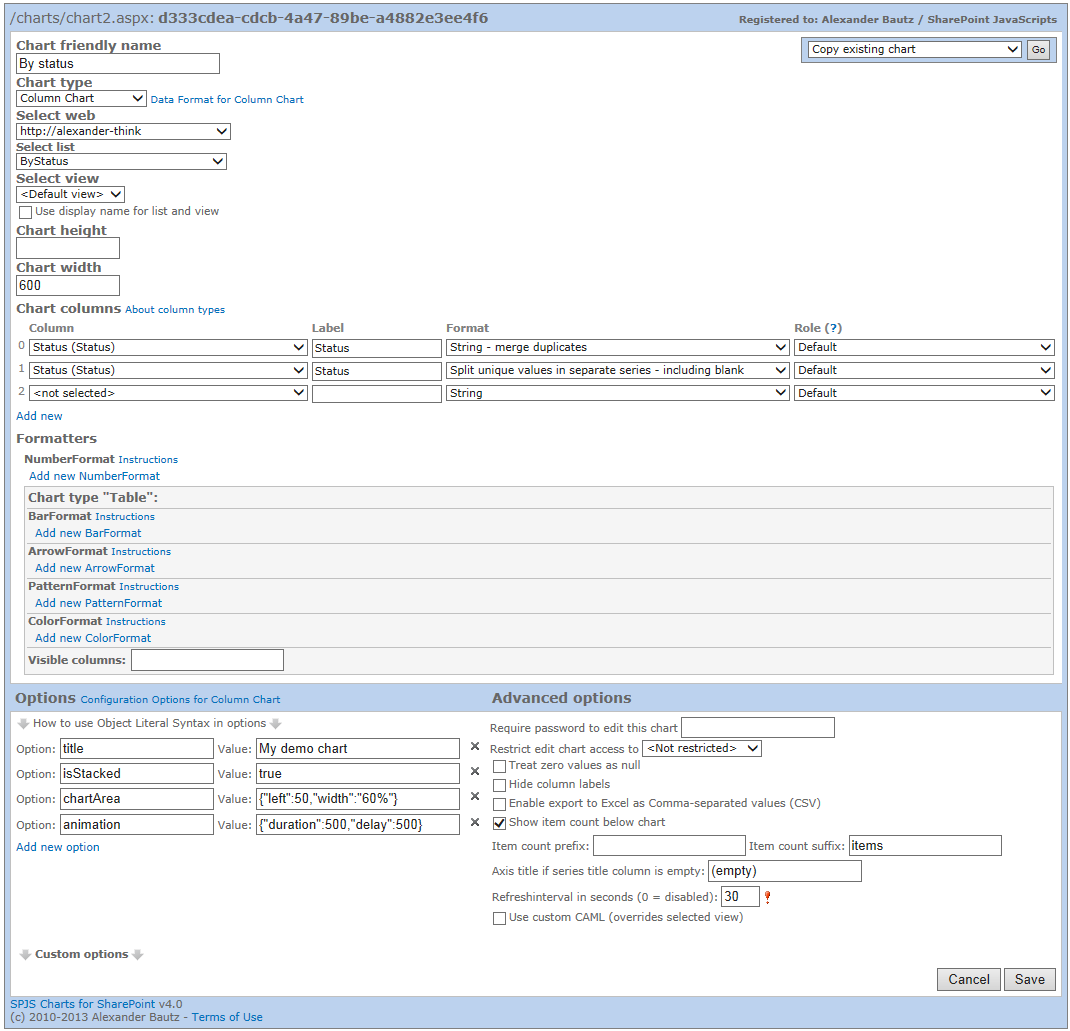
Configuring your first chart

The placeholder for the chart is indicated with a little gray downarrow where you put the CEWP. Click this image to load the configuration GUI. Here is an example chart with the configuration:
IMG
IMG

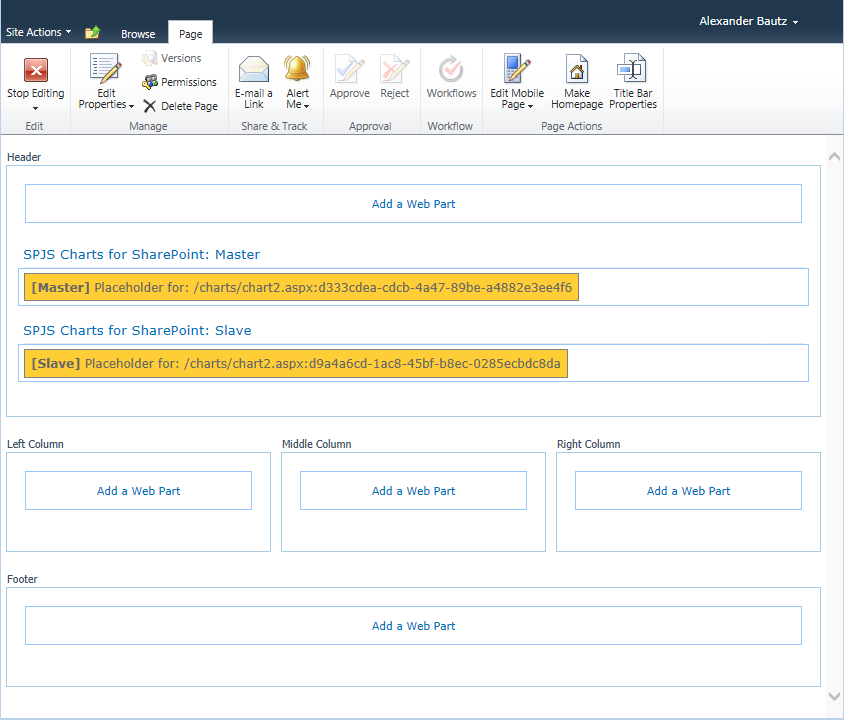
Multiple charts in the same page

In this version you basically have two different “Web parts”: The MASTER with the code referred in step 5 above, which calls the script resources, and the SLAVE which is simply any HTML DOM element with the class “spjs_chartPlaceholder”. This element can be for example a div, span or td. You can add it inline in the text, or set it up in a table structure.

The CEWP code for a SLAVE chart

<div class="spjs_chartPlaceholder"></div>
Please note that you can NOT add the “slave code” directly to a CEWP source editor. Either use the content link option in the CEWP to link to a file with the code, or use a HTML form web part. This is necessary because SharePoint messes with the code by appending the script generated contents to the CEWP when you edit the page.

You can add one Master Web Part to a page, and unlimited number of Slave Web Parts (in theory, buy your page will load slowly if you have to many charts in one page).

See separate article for instructions on how to create Web Part templates in the Web Part Gallery.

Placeholders in edit page mode

When entering edit page mode, the placeholders are highlighted like this:
IMG

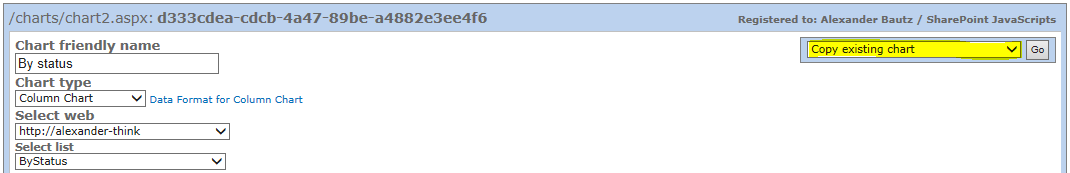
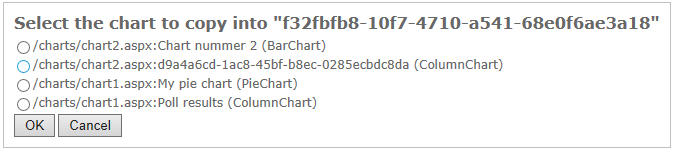
Copy an existing chart

If you have the licensed version, you can copy existing charts (from v4) in two ways.
Method 1
IMG
IMG

Method 2:
Go to the chart you want to copy, select “Export configuration as text”:
IMG
IMG

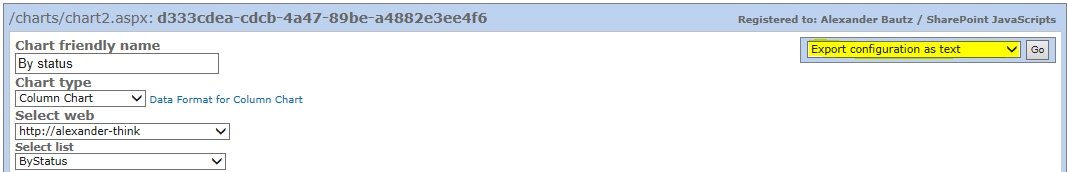
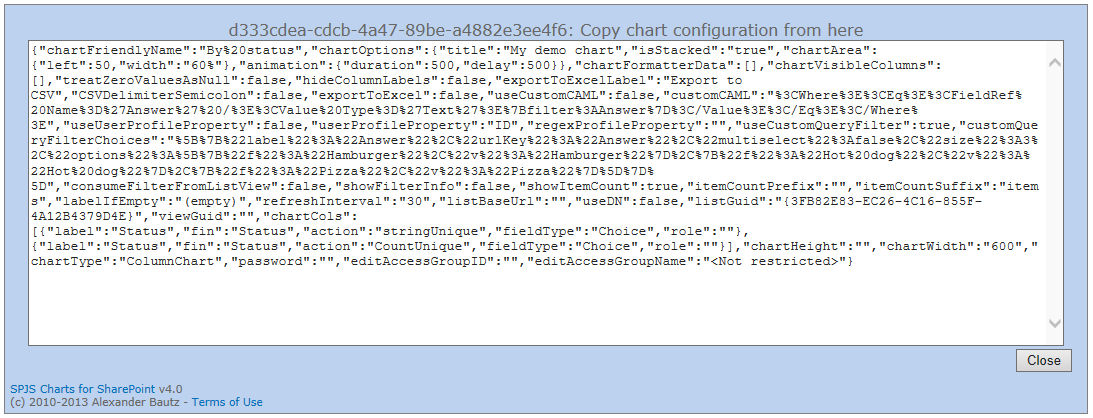
Copy the text and then use “Import configuration from text” and paste it back in the new location.

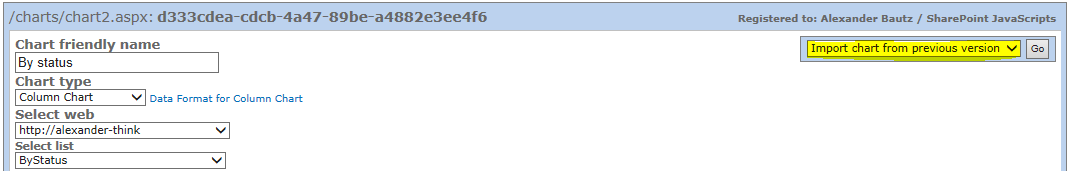
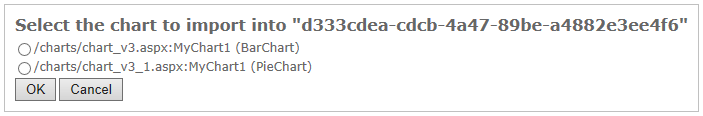
Import charts from v3

If you have the licensed version, you can import existing charts (from v3) like this:
IMG
IMG

You find other articles in this series here: https://spjsblog.com/category/SPJS-Charts-for-SharePoint-v4

Do you want to buy a license code?

Click here to to learn how to obtain a license code https://spjsblog.com/license-code.

Ask if anything is unclear,
Alexander

SPJS Charts for SharePoint: Export to Excel and SP2013 support

A few months ago I received this email from Aymeric:

Hi Alexander,

I’ve created a JS API to use with Sharepoint. You may want to have a look at it: http://aymkdn.github.com/SharepointPlus/
I think this library could be useful for some other people. It’s on GitHub so feel free to share any comments.

Thank you,
Aymeric

It took me “forever” to look at this API, but I finally had a go at it, and decided to use one of the methods: createFile in the SPJS Charts for SharePoint solution to be able to export the chart data to Excel as a CSV file.

New in v3.4 of SPJS Charts for SharePoint

You find the “Enable export to Excel as comma-separated values (CSV)” under the “Advanced options” section in the SPJS Charts for SharePoint GUI. When you enable this feature (done individually for each chart), you can hover over the chart to show a label in the bottom right corner of the chart. Hit this to create the file. When the file is successfully created, you are prompted to open it directly.

To achieve this I included the file “sharepointplus-3.0.3.js” in the CEWP code, and I created a function that exports the chart data as comma-separated values, which I then “inject” in a dedicated document library using Aymerics API method “createFile”. This document library is automatically created the first time you save a chart with the “Export feature” enabled.

You do NOT have to load the “sharepointplus-3.0.3.js” file if you do not intend to use the export to CSV feature. If you try to enable it, and “sharepointplus-3.0.3.js” is not loaded, you will get instruction on how to get hold of the file.

The exported files

The files are named from the path to the page where the chart is located, the chart id and the user ID of the user exporting the chart. This means that the library “SPJS_ExcelExports” will not get filled up as the file is overwritten for each time the user exports the same chart. If you want to keep the file, save it in another location, or at least save it with another name to prevent it from being overwritten.

Example of the CEWP code with “sharepointplus-3.0.3.js” loaded:

<style type="text/css">
div.chartLoadingOverlay{
	font-style:italic;
	color:gray;
	border:1px silver solid;
	background-color:#F5F5F5;
	line-height:250px;
	height:250px;
	width:500px;	
	text-align:center;	
	margin:2px;
}
</style>

<!-- The chart container is set up with an overlay to let the user know the chart is rendering -->
<div id="MyChart1">
	<div class='chartLoadingOverlay'>Loading chart please be patient...</div>
</div>

<script type="text/javascript">
/*****************************************************
		Address all containers
*****************************************************/
// All charts must be represented by a container with a unique id. 
// This container  must be present in the page
var arrOfChartContainers = ["MyChart1"];
var loadRC = false;
// Set this to true to allow for the use of variables in the "Filter setup textarea"
var allowEval = false;
// Set this to true to delay the loading of the chart.
var loadManually = true;
// You can override chart options set in the GUI
var chartOptionOverride = {"TheChartID":{"title":"This is the chart title!"}};
</script>
<script type="text/javascript" src="https://ajax.googleapis.com/ajax/libs/jquery/1.9.1/jquery.min.js"></script>
<script type="text/javascript" src="https://www.google.com/jsapi"></script>
<script type="text/javascript" src="/test/English/Charts/Javascript/SPJS_ChartsForSharePoint_v3.4.js"></script>
<!-- Used to enable export of chart data as CSV -->
<script type="text/javascript" src="/test/English/Charts/Javascript/sharepointplus-3.0.3.js"></script>
<!-- Used to enable export of chart data as CSV -->
<script type="text/javascript">
// This function will load the charts
function manualLoad(){
	loadManually = false;
	spjs_GenerateChart();
}

// Delay the call to the function by 10ms to give the overlay time to render 
setTimeout(function(){
	manualLoad();
},10);
</script>
SharePoint 2013

In v3.4 I have made a “quick pass” trough the code to fix some compatibility issues for SharePoint 2013.

Because this solution is funded with an occasional beer donation, I cannot fully test it as if it was a commercial product. Therefore I must rely on you guys to find the rest of the bugs. Post them here, and I’ll fix them as soon as I can manage.

Alexander

SPJS Charts for SharePoint update 20.09.2012

27.09.2012 v3.3.6 includes these changes:

  • Changed the method for caching the filter values when loading the charts and changing the filter dropdowns. This should fix any errors when you have multiple filtered charts in one page.
  • Added option to override “chart options” set in the GUI by adding an object to the CEWP like this:
    var chartOptionOverride = {&quot;MyChart1&quot;:{&quot;title&quot;:&quot;This is the chart title!&quot;}};
    

See the CEWP code example for v3.3.6 in the download section


In v3.3.5 I have added these features:

  1. Changed the way the chart and the accessories are rendered to keep all items within the “chart container”. This helps in positioning the charts in the page.
  2. Added option to load the chart manually.
  3. Added option to display a placeholder / overlay when the chart is loading. This will prevent the page from looking like it has frozen while loading a heavy chart. The page is still unresponsive – but at least it looks better.
1.

What happens under the hood is that the chart is created in a separate container – dynamically created within the container defined in the CEWP. For those interested, this container is named containerId_chart. Where “containerId” is the id defined in the array “arrOfChartContainers” in the CEWP.

2.

You can delay the loading of the chart by 4000ms (4 seconds) like this:

&lt;div id=&quot;MyChart1&quot;&gt;&lt;/div&gt;
&lt;script type=&quot;text/javascript&quot;&gt;
/*****************************************************
		Address all containers
*****************************************************/
// All charts must be represented by a container with a unique id. 
// This container  must be present in the page
var arrOfChartContainers = [&quot;MyChart1&quot;];
var loadRC = false;
var allowEval = false;

var loadManually = true;
function manualLoad(){
	loadManually = false;
	spjs_GenerateChart();
}

setTimeout(function(){
	manualLoad();
},4000);

&lt;/script&gt;
&lt;script type=&quot;text/javascript&quot; src=&quot;https://ajax.googleapis.com/ajax/libs/jquery/1.7.2/jquery.min.js&quot;&gt;&lt;/script&gt;
&lt;script type=&quot;text/javascript&quot; src=&quot;https://www.google.com/jsapi&quot;&gt;&lt;/script&gt;
&lt;script type=&quot;text/javascript&quot; src=&quot;/test/English/Charts/Javascript/3.3/SPJS_ChartsForSharePoint_v3.3.5.js&quot;&gt;&lt;/script&gt;

Or you can make a button and call the chart manually like this:

&lt;input type=&quot;button&quot; onclick=&quot;manualLoad()&quot; value=&quot;Load chart&quot;&gt;
&lt;div id=&quot;MyChart1&quot;&gt;&lt;/div&gt;
&lt;script type=&quot;text/javascript&quot;&gt;
/*****************************************************
		Address all containers
*****************************************************/
// All charts must be represented by a container with a unique id. 
// This container  must be present in the page
var arrOfChartContainers = [&quot;MyChart1&quot;];
var loadRC = false;
var allowEval = false;

var loadManually = true;
function manualLoad(){
	loadManually = false;
	spjs_GenerateChart();
}
&lt;/script&gt;
&lt;script type=&quot;text/javascript&quot; src=&quot;https://ajax.googleapis.com/ajax/libs/jquery/1.7.2/jquery.min.js&quot;&gt;&lt;/script&gt;
&lt;script type=&quot;text/javascript&quot; src=&quot;https://www.google.com/jsapi&quot;&gt;&lt;/script&gt;
&lt;script type=&quot;text/javascript&quot; src=&quot;/test/English/Charts/Javascript/3.3/SPJS_ChartsForSharePoint_v3.3.5.js&quot;&gt;&lt;/script&gt;
3.

To have a placeholder like this while the chart loads:
IMG

You must add this code to your CEWP:

&lt;style type=&quot;text/css&quot;&gt;
.chartLoadingOverlay{
	font-style:italic;
	color:gray;
	border:1px silver solid;
	background-color:#F5F5F5;
	line-height:250px;
	height:250px;
	width:500px;	
	text-align:center;	
	margin:2px;
}
&lt;/style&gt;

&lt;div id=&quot;MyChart1&quot;&gt;&lt;/div&gt;
&lt;script type=&quot;text/javascript&quot;&gt;
/*****************************************************
		Address all containers
*****************************************************/
// All charts must be represented by a container with a unique id. 
// This container  must be present in the page
var arrOfChartContainers = [&quot;MyChart1&quot;];
var loadRC = false;
var allowEval = false;

var loadManually = true;
function manualLoad(){
	loadManually = false;
	spjs_GenerateChart();
}
&lt;/script&gt;
&lt;script type=&quot;text/javascript&quot; src=&quot;https://ajax.googleapis.com/ajax/libs/jquery/1.7.2/jquery.min.js&quot;&gt;&lt;/script&gt;
&lt;script type=&quot;text/javascript&quot; src=&quot;https://www.google.com/jsapi&quot;&gt;&lt;/script&gt;
&lt;script type=&quot;text/javascript&quot; src=&quot;/test/English/Charts/Javascript/3.3/SPJS_ChartsForSharePoint_v3.3.5.js&quot;&gt;&lt;/script&gt;
&lt;script type=&quot;text/javascript&quot;&gt;

$.each(arrOfChartContainers,function(i,id){
	$(&quot;#&quot;+id).html(&quot;&lt;div class='chartLoadingOverlay'&gt;Loading chart please be patient...&lt;/div&gt;&quot;);
});
setTimeout(function(){
	manualLoad();
},100);
&lt;/script&gt;

The setTimeout is necessary to let the browser render the overlay before it freezes while retrieving the data for the chart.

Please note the these features require v3.3.5 of SPJS Charts for SharePoint.

You find the files, and additional information in this article

Alexander

SPJS Charts for SharePoint update 18.07.2012

I have updated SPJS Charts for SharePoint to v3.3 and added a few new features.

You find the code in the original article

1. Option to have multi select in filter select

IMG
When setting up a chart filter, you now have an option “multiselect” which you can set to true to have multiple selection in the filter select. You can also specify the size of the select. See the “Instructions” link above the filter setup textarea.

2. Added formatter: ColorFormat

Description pulled from here
Assigns colors to the foreground or background of a numeric cell, depending on the cell value. This formatter is an unusual, in that it doesn’t take its options in the constructor. Instead, you should call addRange() or addGradientRange() as many times as you want, to add color ranges, before calling format(). Colors can be specified in any acceptable HTML format, for example “black”, “#000000”, or “#000”.

3. Added DataTable Roles (Experimental)

IMG
Dotted line represents uncertain numbers.

Description pulled from here
Google DataTable and DataView objects now support explicitly assigned column roles. A column role describes the purpose of the data in that column: for example, a column might hold data describing tooltip text, data point annotations, or uncertainty indicators.

Previously, there were only two roles available to a column: ‘domain’ which specifies major axis labels; and ‘data’ which specifies bar heights, pie slice widths, and so on. These roles were assigned implicitly, based on the order and type of the columns in the table. However, with the ability to explicitly assign column roles, you can now add optional columns that provide new, interesting features to a chart such as arbitrary annotation labels, hovertext, and uncertainty bars.

4. Filter multiple charts with the same filter controls

You can apply the same filter on multiple charts in a page. To do this, add the parameter “filterAdditionalCharts” to the filter setup textarea like this:

[{&quot;label&quot;:&quot;Year&quot;,&quot;urlKey&quot;:&quot;year&quot;,&quot;filterAdditionalCharts&quot;:[&quot;MyChart2&quot;],&quot;options&quot;:[{&quot;f&quot;:&quot;All&quot;,&quot;v&quot;:&quot;*&quot;},{&quot;f&quot;:&quot;2010&quot;,&quot;v&quot;:&quot;2010&quot;},{&quot;f&quot;:&quot;2011&quot;,&quot;v&quot;:&quot;2011&quot;},{&quot;f&quot;:&quot;2012&quot;,&quot;v&quot;:&quot;2012&quot;}]}]

You supply an array of additional chart container IDs to apply this filter to. If you set up multiple filters, you only have to set this parameter for the first filter select. In the additional charts, you must set up the Custom CAML to consume the filter values.

5. boolean configuration options will now be handled properly

Previously there were a problem using boolean options like “sortAscending”. This has now been fixed.

6. Alphabetically sorted field names in field select – now with FieldInternalName in parentheses

In the “Edit Chart GUI” the field names are now Alphabetically sorted. You also have the FieldInternalName in parentheses behind the display name. This might come in handy when setting up custom CAML.

7. Load the Google Visualization API release candidate

Google periodically releases a new version of the Google Visualization API. As the API does not have support for versioning, the new version is forced on everyone using this tool. To stay one step ahead, you might want to check out the release candidate before it goes live. To do this, you can set the variable “loadRC” to true in the CEWP code (as before), or you can now use a query string parameter in the URL like this:

../MyPage.aspx?loadRC=1

Alexander