Fixed a few bugs in the new version – you find the change log here: https://spjsblog.com/spjs-charts-for-sharepoint/spjs-charts-for-sharepoint-v7-change-log/
Alexander
Fixed a few bugs in the new version – you find the change log here: https://spjsblog.com/spjs-charts-for-sharepoint/spjs-charts-for-sharepoint-v7-change-log/
Alexander
Fixed a few bugs in the new version – you find the change log here: https://spjsblog.com/spjs-charts-for-sharepoint/spjs-charts-for-sharepoint-v7-change-log/
Alexander
Finally I have released the final version of SPJS Charts v7 – you find it here.
I haven’t been able to update the user manual to describe the changes from v6, but basically the setup and most functionality is the same. The Custom datasource option is also linked in the top of the user manual.
The solution has been updated to use asynchronous REST calls instead of the old webservice calls. This means the page responsiveness is better if you have multiple charts in one page.
You can still use a CAML query to filter the datasource, and in that case it will still use webservice calls, but asynchronous so the page don’t freeze up when waiting for the results. This does in fact make the query faster that with REST.
Please post any questions in the forum, or feedback in the comments below.
PS: Existing v6 licenses are still valid for v7.
Best regards,
Alexander
I have fixed a few issues and have released a new BETA.
You find information about SPJS Charts v7 and a link to download it here: https://spjsblog.com/2018/04/29/spjs-charts-v7/
Please report back any issues you might have with this release – and if I don’t get any new bug reports I’ll get a prod release out later this week.
Alexander
I have fixed an issue with BETA 2 where I accidentally left a user group in the variable spjscharts_restrictAddNewChartToGroup in the SPJSCharts_loader.html like this:
var spjscharts_restrictAddNewChartToGroup = "TestGroup1";
This would prevent the add new chart button from showing. The default value here should be like this:
var spjscharts_restrictAddNewChartToGroup = "";
I have also removed a call to get the user profile for the current user because this failed in SP foundation where the user profile is not accessible.
You find information about SPJS Charts v7 and a link to download it here: https://spjsblog.com/2018/04/29/spjs-charts-v7/
Alexander
Last updated: May 12, 2018
I have upgraded SPJS Charts for SharePoint to use REST queries to load data. This means the loading is now asynchronous and therefor the page will be more responsive while the the charts are loading.
Please note that this new version does not support SP 2007 and SP 2010.
You find the BETA here. Follow the installation instruction for v6 to set it up.
Most of the functionality is the same as in v6, but I have added one new feature for advanced users.
In the “Basic setup” tab you no have two options for Datasource. The “SharePoint list” option is the same as before, but the new “Custom datasource” option lets you load the data-source with a custom JavaScript function.
This way you can for example combine two or more queries to build one chart in a page. I’ll describe this functionality below.
When selecting the “Custom datasource” radio button, you will see a new textarea for the configuration of “Datatable fields” and the function name to use to query for the data:
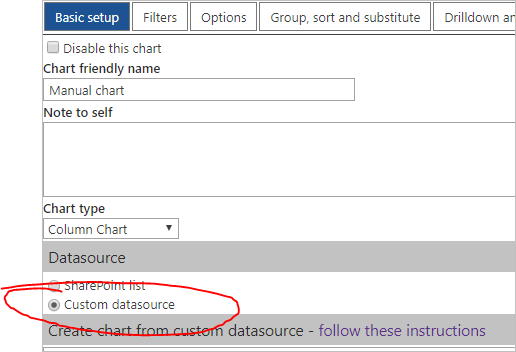
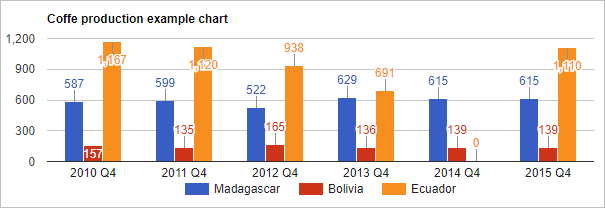
This example chart is set up with a custom datasource built with the below configuration.
This is an example of the “Custom datasource” configuration:
{
 "type":"function",
 "functionName":"getChartCustomDatasource",
 "columns":[
 {"fin":"Date","label":"Date","type":"DateTime","dataType":"date","role":""},
 {"fin":"Madagascar","label":"Madagascar","type":"Text","dataType":"number","role":""},
 {"fin":"Bolivia","label":"Bolivia","type":"Text","dataType":"number","role":""},
 {"fin":"Ecuador","label":"Ecuador","type":"Text","dataType":"number","role":""}
 ]
}
The function name getChartCustomDatasource must be available in the page. Either by adding it to a custom js file loaded trough the “Load external JS or CSS” tab, or by adding it to a script editor web part in the page.
The below example shows a basic query to get the dataset from a SharePoint list:
function getChartCustomDatasource(chartId){
 var deferred = jQuery.Deferred();
 spjs.charts.getItemsREST({
 "listId":"{5ebb17fb-eb6d-4a01-ac86-a241458ff8f2}",
 "listBaseUrl":"/SPJSCharts",
 "select":["Date","Madagascar","Bolivia","Ecuador"],
 "expand":[],
 "filter":"",
 "rowLimit":""
 }).done(function(data){
 deferred.resolve(data);
 }).fail(function(err){
 // console.log(err);
 });
 return deferred.promise();
}
You can however user any sort of query you can run with JavaScript from within SharePoint, as long as the dataset returned from the query is in this format:
[{
 "Bolivia": "165",
 "Ecuador": "938",
 "Madagascar": "522",
 "Created": "2014-03-24T21:41:00Z"
}, {
 "Bolivia": "135",
 "Ecuador": "1120",
 "Madagascar": "599",
 "Created": "2014-03-24T21:41:08Z"
}, {
 "Bolivia": "157",
 "Ecuador": "1167",
 "Madagascar": "587",
 "Created": "2014-03-24T21:41:08Z"
}, {
 "Bolivia": "136",
 "Ecuador": "691",
 "Madagascar": "629",
 "Created": "2014-03-24T21:41:08Z"
}, {
 "Bolivia": "139",
 "Ecuador": "0",
 "Madagascar": "615",
 "Created": "2014-03-24T21:41:08Z"
}, {
 "Bolivia": "139",
 "Ecuador": "1110",
 "Madagascar": "615",
 "Created": "2016-04-02T22:18:55Z"
}, {
 "Bolivia": "345",
 "Ecuador": "456",
 "Madagascar": "429",
 "Created": "2016-04-03T07:11:10Z"
}, {
 "Bolivia": "333",
 "Ecuador": "22",
 "Madagascar": "555",
 "Created": "2016-04-03T14:58:45Z"
}]
You can also add the data for the chart manually in the textarea like this:
{
 "type":"manual",
 "columns":[
 {"fin":"Status","label":"Status","type":"Text","dataType":"SplitInSeries","role":""},
 {"fin":"Department","label":"Department","type":"Text","dataType":"string","role":""}
 ],
 "data":[
 {"Department":"North","Status":"Not started"},
 {"Department":"North","Status":"In progress"},
 {"Department":"South","Status":"In progress"},
 {"Department":"South","Status":"Completed"}
 ]
}
Because of the changed query method, v7 is not unfortunately not backwards compatible with v6 and you must rebuild the charts in v7.
To make the upgrade process easier, the two versions can both be installed in the same site, but you cannot load both versions in the same page.
If you have an existing license for v6 you can use the same license code in v7.
Please post any feedback in the forum or in the comments below.
Alexander
I have published a new version of SPJS Charts for SharePoint with a few minor layout changes and a fix for an error when adding a chart to a page and getting an error related to “ZoneId”. You find the change log here and you can download the files here.
As mentioned when publishing the last update back in December 2017 I have worked on a new version that uses REST to query the datasource. This version will also be able to use a custom datasource built from a query or a static JSON object. This version will soon be published in BETA.
Please post any questions in the forum.
Alexander
I have published a new version of SPJS Charts for SharePoint with a few minor changes. You find the change log here.
I plan to update the solution to use REST queries from the next version. The next version will therefore drop support for SharePoint versions prior to SP 2013.
Please post any questions in the forum.
Alexander