Category Archives: CAML Query

Pull on-call information from calendar

10.06.2011 Update: I forgot to separate out the FieldInternalNames for the start and end date. See updated code.


This solution is an answer to a request from Colin Blake:

Hey Alexander,

I’ve been browsing through your blog (amazing!) and have not been able
to come up with anything yet using your posted solutions so I was
hoping you could help me or get me pointed in the right direction. I
have a calender that holds our “On-Call” information. I have added a
custom column to the calender that holds a text value(the name of the
on call person). What I would like to do is is on another Web Part
Page is have the text value from the custom “on-call” column for the
current week displayed in a CEWP Web Part. Is this something that
could be easily done?

Thanks,
Colin Blake

This solution is designed to be put directly into a CEWP and will insert the name of the person “on call” in a placeholder <div>.

Note to SharePoint 2010 users:
Add this code to a text file and put it in a document library, then use the content link option on the CEWP to link to this code. This is necessary to overcome a “bug” in the CEWP handling when editing a SP2010 page. If you put a script that generates HTML directly into a CEWP, the HTML is accumulated when editing the page.

CEWP code:

&lt;div id=&quot;insertOnCallNameHere&quot;&gt;&lt;/div&gt;
&lt;script type=&quot;text/javascript&quot; src=&quot;https://ajax.googleapis.com/ajax/libs/jquery/1.6.1/jquery.min.js&quot;&gt;&lt;/script&gt;
&lt;script type=&quot;text/javascript&quot;&gt;

// Define list name or GUID
var calendarName = &quot;OnCallCalendar&quot;;
// Define the FieldInternalName to pull in the value from
var fieldToReturn = 'OnCallPerson';
// Define the start and end date fields
var startDateFIN = 'EventDate';
var endDateFIN = 'EndDate';
// Call the cunction
var onCallArr = getOnCallInfo(calendarName,fieldToReturn,startDateFIN,endDateFIN);

// Handle the result
var buffer = [];
$.each(onCallArr,function(i,obj){
	// obj.url = hyperlink to profile page
	// obj.name = name
	// obj.userId = user id
	// url and userid is available only when &quot;fieldToReturn&quot; is a people picker.
	buffer.push(&quot;&lt;div&gt;&quot;+obj.url+&quot;&lt;/div&gt;&quot;);
});
$(&quot;#insertOnCallNameHere&quot;).html(buffer.join(''));

// ****************************************************************
//	Do not edit below this line
// ****************************************************************

function getOnCallInfo(listName,fieldNameToReturn,startDateFIN,endDateFIN){
	var result = [];
	var queryBuffer = [];
		queryBuffer.push(&quot;&lt;Where&gt;&quot;);
		queryBuffer.push(&quot;&lt;And&gt;&quot;);
		queryBuffer.push(&quot;&lt;Leq&gt;&lt;FieldRef Name='&quot;+startDateFIN+&quot;' /&gt;&lt;Value Type='DateTime'&gt;&lt;Today /&gt;&lt;/Value&gt;&lt;/Leq&gt;&quot;);
		queryBuffer.push(&quot;&lt;Geq&gt;&lt;FieldRef Name='&quot;+endDateFIN+&quot;' /&gt;&lt;Value Type='DateTime'&gt;&lt;Today /&gt;&lt;/Value&gt;&lt;/Geq&gt;&quot;);
		queryBuffer.push(&quot;&lt;/And&gt;&quot;);
		queryBuffer.push(&quot;&lt;/Where&gt;&quot;);
	var res = spjs_QueryItems({listName:listName,query:queryBuffer.join(''),viewFields:['ID',fieldNameToReturn]});
	$.each(res.items,function(i,item){
		if(item[fieldNameToReturn]!==null){
			var split = item[fieldNameToReturn].split(';#');
			var name = split[1];
			var userId = split[0];
			if(split.length===2&amp;&amp;!isNaN(parseInt(split[0],10))){
			result.push({url:&quot;&lt;a href='&quot;+L_Menu_BaseUrl+&quot;/_layouts/userdisp.aspx?Force=True&amp;ID=&quot;+userId+&quot;' target='_blank'&gt;&quot;+name+&quot;&lt;/a&gt;&quot;,
						 name:name,
						 userId:userId});
			}else{
				if(split.length===2){
					name = split[1];
				}
				result.push({url:'URL: This value is available using a people picker only.',
							 name:name,
							 userId:'userId: This value is available using a people picker only.'});
			}	
		}	
	});
	return result;		
}

function spjs_QueryItems(argObj){
	if(argObj.listBaseUrl==undefined)argObj.listBaseUrl=L_Menu_BaseUrl;
	if(argObj.listName==undefined || (argObj.query==undefined &amp;&amp; argObj.viewName==undefined)){
		alert(&quot;Missing parameters!nnYou must provide a minimum of &quot;listName&quot;, &quot;query&quot; or &quot;viewName&quot; and &quot;viewFields&quot;.&quot;);
		return;
	}
	var content = spjs_wrapQueryContent({'listName':argObj.listName,'query':argObj.query,'viewName':argObj.viewName,'viewFields':argObj.viewFields,'rowLimit':argObj.rowLimit,'pagingInfo':argObj.pagingInfo});
	var result = {'count':-1,'nextPagingInfo':'',items:[]};	
	spjs_wrapSoapRequest(argObj.listBaseUrl + '/_vti_bin/lists.asmx', 'http://schemas.microsoft.com/sharepoint/soap/GetListItems', content, function(data){
		result.count = $(data).find(&quot;[nodeName='rs:data']&quot;).attr('ItemCount');
		result.nextPagingInfo = $(data).find(&quot;[nodeName='rs:data']&quot;).attr('ListItemCollectionPositionNext');
		$(data).find(&quot;[nodeName='z:row']&quot;).each(function(idx, itemData){
			var fieldValObj = {}
			$.each(argObj.viewFields,function(i,field){
				var value = $(itemData).attr('ows_' + field);
				if(value == undefined) value = null;
				fieldValObj[field]=value;
			});
			result.items.push(fieldValObj);
		});
	});
	return result;
}

function spjs_wrapQueryContent(paramObj){
	var result = [];
	result.push('&lt;GetListItems xmlns=&quot;http://schemas.microsoft.com/sharepoint/soap/&quot;&gt;');
	result.push('&lt;listName&gt;' + paramObj.listName + '&lt;/listName&gt;');
	if(paramObj.viewName!=undefined &amp;&amp; paramObj.viewName!=''){
		result.push('&lt;viewName&gt;' + paramObj.viewName + '&lt;/viewName&gt;');
	}
	if(paramObj.query != null &amp;&amp; paramObj.query != ''){
		result.push('&lt;query&gt;&lt;Query xmlns=&quot;&quot;&gt;');
		result.push(paramObj.query);
		result.push('&lt;/Query&gt;&lt;/query&gt;');
	}
	if(paramObj.viewFields!=undefined &amp;&amp; paramObj.viewFields!='' &amp;&amp; paramObj.viewFields.length &gt; 0){
		result.push('&lt;viewFields&gt;&lt;ViewFields xmlns=&quot;&quot;&gt;');
		$.each(paramObj.viewFields, function(idx, field){
			result.push('&lt;FieldRef Name=&quot;' + field + '&quot;/&gt;');
		});
		result.push('&lt;/ViewFields&gt;&lt;/viewFields&gt;');
	}
	// A view overrides the itemlimit
	if(paramObj.viewName==undefined){
		if(paramObj.rowLimit != undefined &amp;&amp; paramObj.rowLimit &gt; 0){
			result.push('&lt;rowLimit&gt;' + paramObj.rowLimit + '&lt;/rowLimit&gt;');
		}else{
		    result.push('&lt;rowLimit&gt;100000&lt;/rowLimit&gt;');
		}
	}
	result.push('&lt;queryOptions&gt;&lt;QueryOptions xmlns=&quot;&quot;&gt;&lt;IncludeMandatoryColumns&gt;FALSE&lt;/IncludeMandatoryColumns&gt;');
	if(paramObj.pagingInfo != undefined &amp;&amp; paramObj.pagingInfo != null &amp;&amp; paramObj.pagingInfo != '')
		result.push('&lt;Paging ListItemCollectionPositionNext=&quot;' + paramObj.pagingInfo.replace(/&amp;/g, '&amp;amp;') + '&quot; /&gt;');
	result.push('&lt;/QueryOptions&gt;&lt;/queryOptions&gt;');
	result.push('&lt;/GetListItems&gt;');
	return result.join('');
}

function spjs_wrapSoapRequest(webserviceUrl,requestHeader,soapBody,successFunc){
	var xmlWrap = [];
		xmlWrap.push(&quot;&lt;?xml version='1.0' encoding='utf-8'?&gt;&quot;);
		xmlWrap.push(&quot;&lt;soap:Envelope xmlns:xsi='http://www.w3.org/2001/XMLSchema-instance' xmlns:xsd='http://www.w3.org/2001/XMLSchema' xmlns:soap='http://schemas.xmlsoap.org/soap/envelope/'&gt;&quot;);
		xmlWrap.push(&quot;&lt;soap:Body&gt;&quot;);
		xmlWrap.push(soapBody);
		xmlWrap.push(&quot;&lt;/soap:Body&gt;&quot;);
		xmlWrap.push(&quot;&lt;/soap:Envelope&gt;&quot;);
		xmlWrap = xmlWrap.join('');
	$.ajax({
		async:false,
		type:&quot;POST&quot;,
		url:webserviceUrl,
		contentType:&quot;text/xml; charset=utf-8&quot;,
		processData:false,
		data:xmlWrap,
		dataType:&quot;xml&quot;,
		beforeSend:function(xhr){
			xhr.setRequestHeader('SOAPAction',requestHeader);
		},
		success:successFunc,
		error:function(xhr){
			alert(xhr.status+&quot;n&quot;+xhr.responseText);
		}
	});
}
&lt;/script&gt; 

The parameters

calendarName: The list name or list GUID of the list/calendar.
fieldToReturn: The FieldInternalName of the field to return the value from.
startDateFIN: The FieldInternalName of the start date field.
endDateFIN: The FieldInternalName of the end date field.

The returnvalue

The returnvalue from call to the function “getOnCallInfo” is an array of objects. The object has three properties:
url = a link to the SharePoint user info for the user.
userId = the userId from SharePoints user profile.
name = the name stored in the field.

The property “url” and “userId” is for use with people pickers only.

Hope someone can make use of this.
Alexander

Charting for SharePoint using Google Visualization API: Update 05.06.2011


I have posted a new version of the “Charting for SharePoint using Google Visualization API” – v2.9.0. The changes are described here, but the background story and the code is found in original article. This post describes the new features in v2.9.0.

You should read the original post found here, the update for v2.8 posted here and the update for v2.8.5 posted here.


Changes from v2.8.5:

  1. Changed the behavior of “Average” to divide the grand total on the number of columns actually containing a value. This means any columns being blank or “null” will not be considered into the “total column count”. Thanks to Ayodele Ayodeji for pointing this out to me.
  2. Changed the “Chart option parser” to use eval on the Chart Options. YES i know it’s not the smartest thing to do, but as the Google Visualization API changes, my crude “option parser” failed to swallow some of the object literation formatted options.
  3. Added new chart types: Combo Chart and Candlestick Chart
  4. Added support for PatternFormat
  5. Pulled the variables: “showFilterInfo”, “showItemCount”, “itemCountPrefix”, “itemCountSuffix”, “labelIfEmpty”, introduced in v.2.8.5 in from the CEWP code and into the Chart configuration. This update should override the CEWP settings and these obsolete settings should not interfere.
  6. Added a few minor GUI tweaks like auto open the configuration for a newly added chart – no more “Table has no columns” error. Changed some of the error message. And a few other small fixes.
  7. Changed the solution to check for any missing columns in the configuration list and add them as needed. No more need to manually add columns to the configuration list when updating from a previous version!
  8. I have changed the code for the “save configuration function” as jQuery v1.6 introduced a new approach on DOM attributes and properties which affected the value returned by .attr(“checked”). This made saving “checked” checkboxes impossible when using jQuery v1.6.x.

NOTE: I have done one change in the way the formatters are targeted to a column. I originally went for a numbering of the columns starting with 1, but changed this to use 0 for the first column. This has to do with the columns being 0-indexed in the DataTable “behind the scenes” and this making things easier. To those of you using formatters now, you might end up with an error message, but it is just a matter of notching the “index” down by one.

If you use this solution, please consider donating a few dollars.

Hit counter and star rating for SharePoint

Change log
June 06. 2013
I have updated the code to v2.3 to fix some problems with “countOneHitPerUser”, “countOneHitPerUserPerDay” and “oneRatingPerUser” setting not working. Thanks to Jeroen for pointing this out.

April 23. 2013
I have updated the code to use spjs-utility.js and to support newer versions of jQuery. I have tested with v1.91. v2.0 has not been tested.

04.09.2011
I have changed code to allow turning off the star-rating function. The version number is 2.1.

The file “HitCounterAndStarRatingForSharePoint.js” and the CEWP code has changed.

I have redone the Hit counter for SharePoint and changed from a simple “Like” to a star-rating.

I have done a total rebuild of the code and this new release will perform better in lists with a large number of hits.

Note: If your pages will have more than a few thousand hits, you most likely would want to hide the “hitcount” from the users. This has to do with the fact that rendering the number of hits in the browser requires the data to be pulled down to the client for counting.

As an example, 8000 “hits” will be a 2-3MB download to the client just to display the itemcount.

If you hide the counter from the user, you can still display the itemcount by looking at the “HitCounter-list” directly.

I would love to have a webservice that could return the itemcount from a given CAML query without having to pull down the entire XML-blob to the client. If someone has the knowledge to make such a webservice i would be more than happy to make it available here.

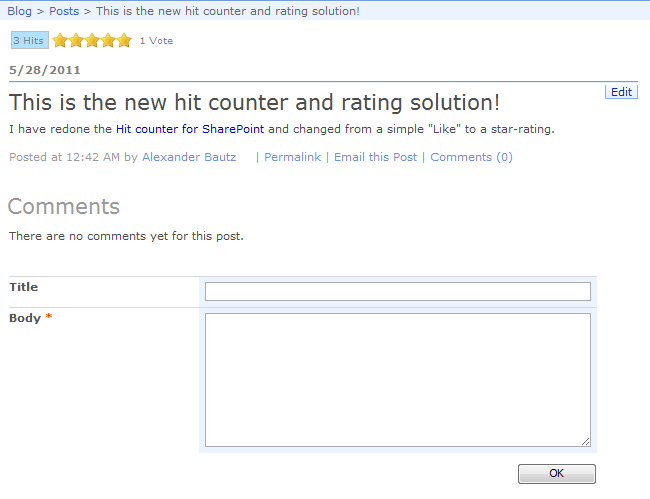
Here how it could look like in a blog:
IMG

How to setup the solution:


Step 1:
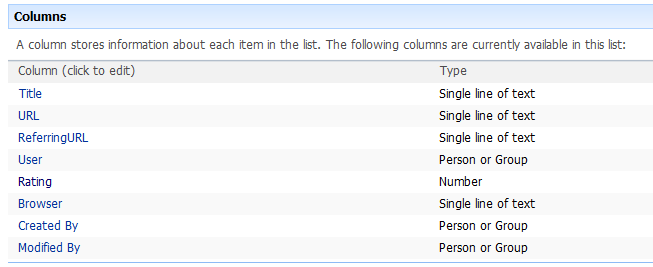
Create a list to hold the ratings. This list could be shared by all sites in a site collection if you point to it in the CEWP configuration option “counterListBaseUrl” and ensure all site users have write permission. The list should have these fields:
IMG


Step 2:
Download the code for the file “HitCounterAndStarRatingForSharePoint.js” and the images star_off.gifstar_on.gifstar_selected.gif from here, and spjs-utility.js from here

Put them in a document library where all users have read permission. If you are using SharePoint Designer you could put the files in a folder on the site collection root for safe storage.


Step 3:
Insert a CEWP with this code where you want the hitcounter/rating to appear:

Updated with reference to spjs-utility.js

<span id="hitAndLike"></span>
<script type="text/javascript" src="/test/English/Scripts/HitAndStar/jquery-1.9.1.min.js"></script>
<script type="text/javascript" src="/test/English/Scripts/HitAndStar/spjs-utility.js"></script>
<script type="text/javascript" src="/test/English/Scripts/HitAndStar/HitCounterAndStarRatingForSharePoint.js"></script>
<script type="text/javascript">
	var argObj = {counterListName:'HitCounter',
				  counterListBaseUrl:'/test/English/Blog/',
				  countHits:true,
				  hitCounterVisible:true,				  
				  countOneHitPerUser:false,
				  countOneHitPerUserPerDay:false,
				  hitSuffix:['Hit','Hits'],				  	  
				  isDispForm:true,
				  activateRating:true,
				  starImageSrc:['/test/English/blog/Scripts/HitCounter/star_off.gif',
				  				'/test/English/blog/Scripts/HitCounter/star_on.gif',
				  				'/test/English/blog/Scripts/HitCounter/star_selected.gif'],
				  starCount:5,
				  starMouseoverArr:['Very poor','Poor','Good','Very good','Fantastic'],
				  oneRatingPerUser:false,
				  ratingCountSuffix:['Vote','Votes'],
				  alreadyRatedMouseover:"You have already given this item {starCount} stars!",				  
				  debug:false};
	hitCounter(argObj);
</script>

NOTE:
Change the script src to reflect the location of your local file.

Note for SharePoint 2010 users:
You cannot put this code in the CEWP directly because of a “bug” in how the CEWP content is handled when editing the page. It basically incorporates the HTML generated by the script and thus corrupts the CEWP code.

To overcome this you must put the CEWP code in a text-file alongside the file “HitCounterAndStarRatingForSharePoint.js” and linking to it using the “Content link” option in the CEWP.

Configuration option:

  • counterListName: The GUID or the “DisplayName” of the hit counter list.
  • counterListBaseUrl: The baseUrl of the “HitCounter” list.
  • countHits: true or false. If false, no hits are recorded. Use this setting if you want star rating only.
  • hitCounterVisible: true or false. If false, the item count is not displayed to the end user. This setting is recommended if you expect a lot of hits and/or your users are on a low bandwidth connection. See note in the top of the article.
  • countOneHitPerUser: true or false. If true, only one hit will ever be recorder for an unique user. If false (and the next parameter also is false) all refreshes of the page will record a new hit in the “HitCounter” list.
  • countOneHitPerUserPerDay: If true, only one hit per day will be recorded for any unique user.
  • hitSuffix: An array with the hit suffix in singular and plural form.
  • isDispForm: true or false. If true, the item ID will be used to distinguish between records in the “HitCounter” list.
  • activateRating New in v2.1: true or false. Turns the star-rating part on or off.
  • starImageSrc: An array containing the relative URL to the 3 images representing the statuses “off”, “on” and “selected”.
  • starCount: The number of stars in you “rating control”. You can have as many as you like.
  • starMouseoverArr: An array of strings describing the rating steps. The text is displayed on mouse over on the star.
  • oneRatingPerUser: true or false. If true, one user can rate an item once.
  • ratingCountSuffix: An array with the rating suffix in singular and plural form.
  • alreadyRatedMouseover: The mouseover if a user has already rated an item. The text “{starcount}” will be replaced with the users rating.
  • debug: true or false. If true, a debug section will be displayed in the top of the screen providing all the configuration options and all variable used by the solution.

Learn how to find the list GUID or the ListBaseUrl

This solution is tested in SP2007 and in SP2010 with IE9.0, Firefox 4.0.1 and Chrome 11.0.696.68.

Copyright and disclaimer

I hope you all enjoy this code and please report any bugs in the comment section below.

Regards
Alexander

PS!

If you like this solution, please consider donating a few dollars to fund some flowers to my wife who must endure my continuous blogging…


Charting for SharePoint using Google Visualization API: Update 05.05.2011


I have posted a new version of the “Charting for SharePoint using Google Visualization API” – v2.8.5. The changes are described here, but the background story and the code is found in original article. This post describes the new features and changes from v2.8.

You should read the original post found here, and the update for v2.8 posted here.


Changes from v2.8:

  1. Removed option to “listen to” specific list filter columns using “{list:FieldInternalName}”
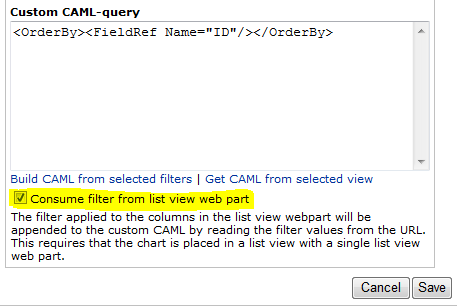
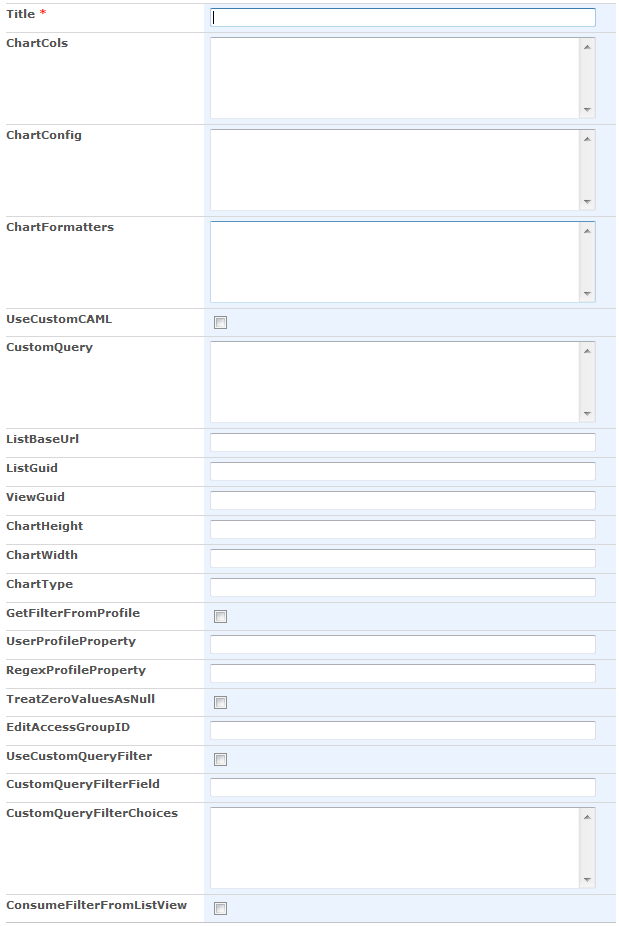
  2. Added option to “consume” a list view web part filter (read from the URL). You can now have the chart “connected” to a list view. Further details below. This new feature requires existing users to manually add one column to the configuration list: “ConsumeFilterFromListView”.
  3. Fixed a bug regarding the use of “&” in a custom filter field which broke the CAML
  4. Added a “counter” to display the total number of items below the chart
  5. Added a few “options” to be set in the CEWP code: “showFilterInfo”, “showItemCount”, “itemCountPrefix”, “itemCountSuffix”, “labelIfEmpty”. All these have a default value and are optional.
  6. Added option to pull the CAML from an existing list view to use as “Custom CAML”

Details on item number 2:

In v2.8 i introduced an option to “hook into” the list view veb part filter for specific columns. In this release this is removed and replaced with an option to “connect to” a list view web part and consume all filters applied to any column.

This has a few limitations:
It reads the filter values from the URL and therefore only one list view webpart can coexist with the chart. If more than one list view web part is placed alongside a chart, it would not know which list the filter came from.

To use this option, check this box:
IMG

This requires existing users to add one column to the configuration list: “ConsumeFilterFromListView”. For new users this field will be added automatically when creating the configuration list. The chart configuration list should look like this:
IMG

Details on item number 4:

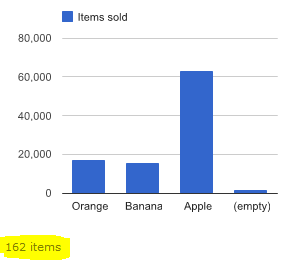
I have added a “counter” to display the total number of items below the chart:
IMG
This counter can be switched off – see next item.

Details on item number 5:

These variables can be added to the CEWP code:

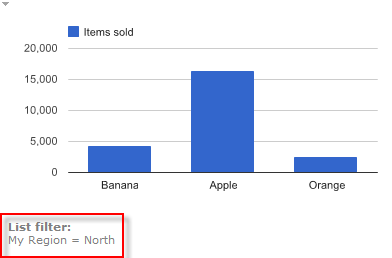
  • showFilterInfo: true [default] or false. Controls the visibility of the “filter label” below the chart when using a filter.
  • showItemCount: true [default] or false. Controls the visibility of the item count below the chart.
  • itemCountPrefix: A string to put in front of the item count. Default empty string.
  • itemCountSuffix: A string to add after the item count. Default ” items”.
  • labelIfEmpty: A string representing the default label for empty values. Default is “(empty)”.

Example CEWP code:

&lt;div id=&quot;MyChart1&quot;&gt;&lt;/div&gt;
&lt;div id=&quot;MyChart2&quot;&gt;&lt;/div&gt;
&lt;script type=&quot;text/javascript&quot;&gt;
/*****************************************************
		Address all containers
*****************************************************/
// All charts must be represented by a container with a unique id. This container  must be present in the page
arrOfChartContainers = [&quot;MyChart1&quot;,&quot;MyChart2&quot;];

var showFilterInfo = true;
var showItemCount = true;
var itemCountPrefix = &quot;A total of &quot;;
var itemCountSuffix = &quot; items&quot;;
var labelIfEmpty = &quot;(no value)&quot;;

&lt;/script&gt;
&lt;script type=&quot;text/javascript&quot; src=&quot;http://ajax.googleapis.com/ajax/libs/jquery/1.5.2/jquery.min.js&quot;&gt;&lt;/script&gt;
&lt;script type=&quot;text/javascript&quot; src=&quot;http://www.google.com/jsapi&quot;&gt;&lt;/script&gt;
&lt;script type=&quot;text/javascript&quot; src=&quot;/test/English/Charts/Javascript/v2.8.5/ChartUsingGoogleVisualizationAPI.js&quot;&gt;&lt;/script&gt;

Details on item number 6:

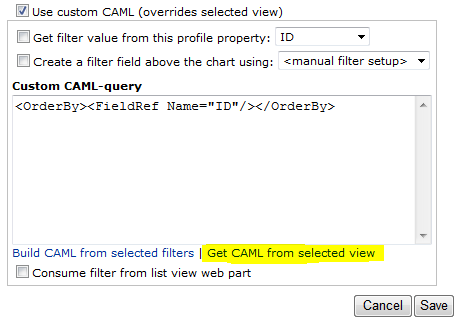
Use this link to pull the CAML from the list view:
IMG
Select a view in the “View selector” and click this link to pull it into the textarea.


Please post a comment if you have questions.

Alexander
Charting for SharePoint using Google Visualization API: Update 27.03.2011

05.05.2011 I have released version 2.8.5. Read about it here


I have posted a new version of the “Charting for SharePoint using Google Visualization API” – v2.8. The changes are described here, but the background story and the code is found in original article. This post describes the new features.


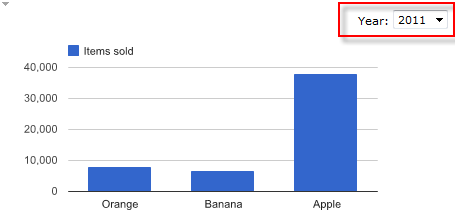
1. Filter the chart using a choice column from the list

IMG
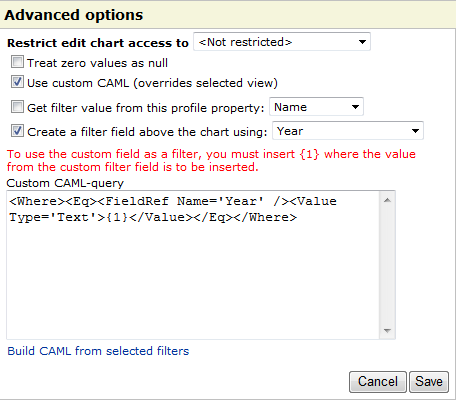
The dropdown is created from the choice options supplied in the list settings for that column. You set the filter in the GUI like this:
IMG
You must use “custom CAML” and select “Create a filter field above the chart using”. In the dropdown you will find all the single-choice columns in your list. Click on the text “Build CAML from selected filters” to create the appropriate CAML query.


2. Manually build the dropdown filter

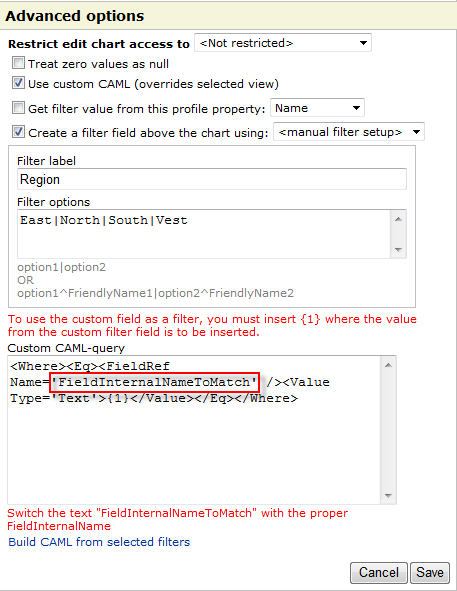
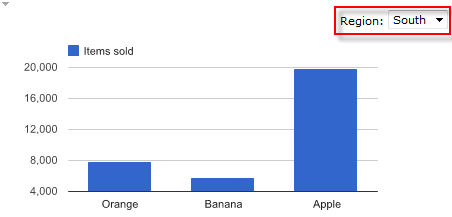
If you want to make a dropdown filter for your chart, filtering by a text in a single line choice column you can create it like this. Click “Create a filter field above the chart using”, and select “manual filter setup”. You can then build the filter manually. See the description below the “filter options” textarea for formatting options for the dropdown.

When using a manual filter setup and using “Build CAML from selected filters”, you must change the “FieldInternalNameToMatch” with the proper FieldInternalName of your target field in the CAML. In this example, switch the text “FieldInternalNameToMatch” with “Region”.
IMG
IMG


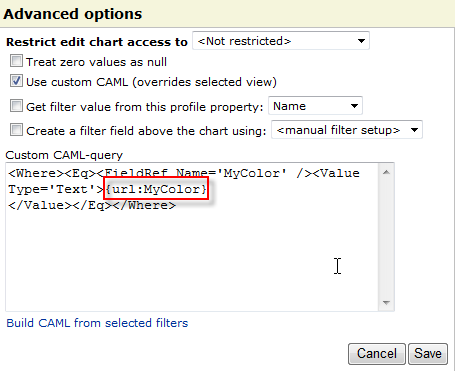
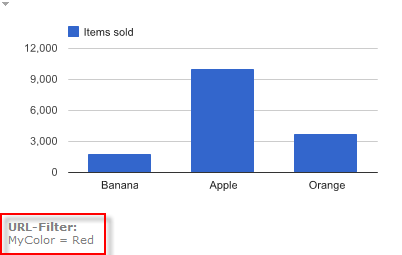
3. Filter the chart using a value from the URL query string

Use {url:ParameterName} as placeholder in the CAML.
IMG
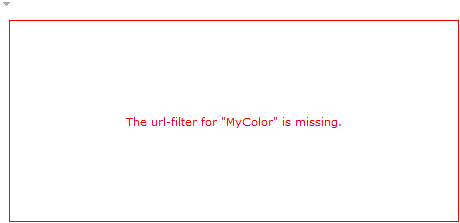
Before the list is filtered, the chart looks like this:
IMG
Pass the filter in the URL like this:
IMG
IMG


4. Filter the chart by filtering the “attached” view

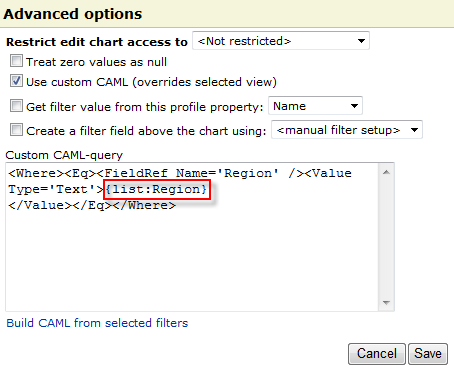
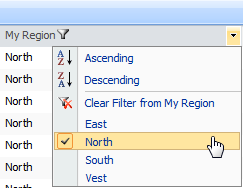
This only applies if the chart is in a page with a single list view. It reads the filter provided by the list filter action and filters the chart accordingly. There are no real connection between the list and the chart – it merely reads the URL and looks for a filter value matching the placeholder in the CAML.

Use {list:FieldInternalName} as placeholder in the CAML.
IMG
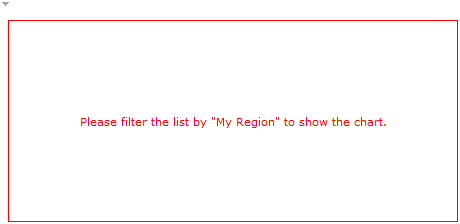
Before the list is filtered, the chart looks like this:
IMG
Filter the list by the appropriate column to render the chart.
IMG
IMG


Important

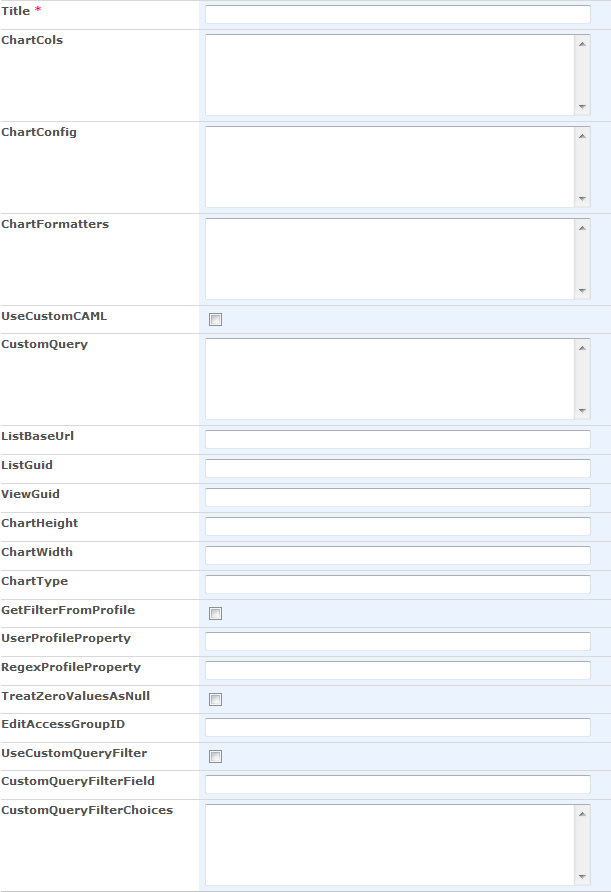
Users upgrading from v2.7 must add three columns to the configuration list:

  • UseCustomQueryFilter: Yes/No column (boolean)
  • CustomQueryFilterField: Single line text
  • CustomQueryFilterChoices: Multi line plain text

For new users, this list is automatically created, but for users upgrading from older versions these fields must be added manually. In that case, compare your configuration list with this image:
IMG


Bugfixes:
If a column name had “&” or “/” in it, the chart “broke”. Thanks to Eric Guy for finding the bug.

I might very well have forgotten something in this walktrough so please post any comment or question below.

Alexander

Poll for SharePoint

March 15, 2015: I have updated this solution. You find v2.0 here.

Please note: The Google Image Charts used in this solution is deprecated and will stop working April 20, 2015.

Change log
January 28. 2014
v1.54 fixes one incompatibility with SP 2013. I have not fully tested this so please let me know if you find any bugs.

July 01. 2013 v1.53: The sort order of answers in chart now reflects the order given in the setup. I have removed some script references so that you now must refer spjs-utility.js – get it here

You must update the CEWP code to include reference to spjs-utility.js

15.12.2011 v1.5.1: Bugfix in the file “PollForSharePoint.js” – line 238. The property “listBaseUrl” were missing – thanks to Jaap Dijkma for finding this bug.


04.12.2011 I have updated the solution to support putting the list in a central location. See “listBaseUrl” below.


22.10.2011 Updated the code to support free input rather than predefined answers – as requested by Claudia:

Hi, thank you for this wonderful piece of code, I think it’s great and we use it on our intranet :).
I wondered if it is possible to use a single line of text for free input instead of radiobuttons with preset answers?
We like to use the poll for ‘brandtagging’ so that people can type keywords.
Just wondering…..
thanks! Claudia

I thought this was a clever idea and have implemented this in v1.4. See updated CEWP code and description below.


17.08.2011 Updated the code with these changes:

  • Lets you view the results and come back to answer.
  • Tidied up the code.
  • The charts now supports https (Thanks to Google).
  • Removed the poll question from the chart title to preserve the formatting.

01.03.2011 Updated the code to fix a bug when “singleResponse” is true. Thanks to “Al”. I have also included two more settings in the “argObj”: qStyle and aStyle. These sets the CSS style of question and answers. See CEWP code below.


28.11.2010 Updated the code to support special characters in the poll question and answers. Thanks to Christophe for the tip.


This code lets you generate polls using JavaScript/jQuery only. No need for server side installed WebParts.

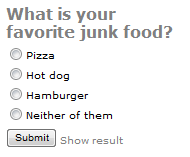
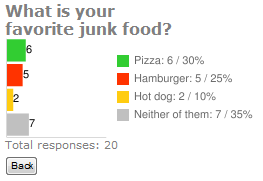
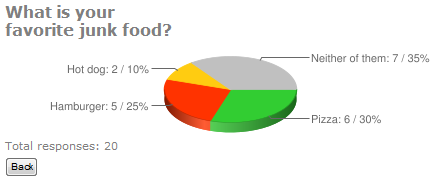
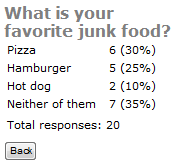
Poll
IMG

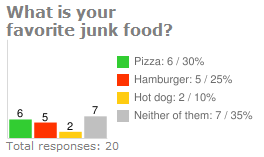
Result with column chart
IMG

Result with bar chart
IMG

Result with pie chart
IMG

Result with “table chart”
IMG

Already answered
IMG

Not active
IMG

Finished
IMG

The charts are generated using Google Chart Tools / Image Charts (aka Chart API).


Create a custom list with the following fields

  • Answer: Single line of text
  • Question: Single line of text

Name it anything you like, but keep the display name fairly simple (no special characters) as you will use the display name in the CEWP code.

CEWP code

The CEWP code below refers jQuery from Google. If you have a local copy of jQuery you can change the script src. You find the code for the file “PollForSharePoint.js” at the bottom of the page. In this example the file “PollForSharePoint.js” is placed in a document library named “Javascript”.

NOTE: You must change the script src for the file “PollForSharePoint.js” and “spjs-utility.js” to point your instance of the files – the CEWP code will not work unless you do this.

Place this code where you want the poll to appear:

<script type="text/javascript" src="http://ajax.googleapis.com/ajax/libs/jquery/1.9.1/jquery.min.js"></script>
<script type="text/javascript" src="/test/English/Javascript/Poll/spjs-utility.js"></script>
<script type="text/javascript" src="/test/English/Javascript/Poll/PollForSharePoint.js"></script>
<script type="text/javascript">

buildQueryWP({pollAnswerListName:'PollA',
				listBaseUrl:L_Menu_BaseUrl,				
				id:'myPoll_01-03-2011', // Allowed characters id a-z, 0-9 - and _
				start:'10/22/2011', // format: mm/dd/yyyy
				end:'11/10/2011', // format: mm/dd/yyyy
				singleResponse:false,
				q:"What is your<br />favorite junk food?",
				qStyle:'font-size:small;font-weight:bold;color:gray',
				aStyle:'font-size:xx-small',
				a:['Pizza','Hot dog','Hamburger','Neither of them'], // Leave empty for free input				
				color:['32CD32','FFCC11','FF3300','C0C0C0'],
				forceLowerCaseAnswer:false, // Group result by lowercase				
				chart:'col', // table, bar, col or pie
				height:100,
				width:450});
</script>

You can control these values in the top of the file “PollForSharePoint.js”:

var submitLinkText = 'Submit';
var backLinkText = 'Back';
var showResultBtnText = 'Show result';
var pollNotActiveText = 'The poll is not active prior to {0}';
var pollEndedText = 'The poll ended on {0}';
var alreadyRespondedText = 'You answered: ';
var totalResponsesLabel = "Total responses: ";

Object attributes explained

  • pollAnswerListName: DisplayName or GUID of the list that stores the answers
  • listBaseUrl: The baseUrl of the site. This is like “/sites/hr” when the list is located in the site “hr” under “/sites”. Use L_Menu_BaseUrl (or omit the property) for current site. New in v1.5
  • id: The unique id of the poll. All poll answers are stored in a list and this id is used to separate each poll
  • start: Start date in the format mm/dd/yyyy
  • end: End date in the format mm/dd/yyyy
  • singleResponse: true for one reply per user, false for unlimited number of replies
  • q: Poll question. To have a linefeed in the question, use <br>
  • qStyle: CSS syntax style
  • aStyle: CSS syntax style
  • a: Answers in an array format. To use free input and not predefined answers, leave the array empty.
  • color: Colors for the chart in an array format. This must have the same length as the previous parameter – one color for each answer
  • forceLowerCaseAnswer: Primarily for use with free input to avoid getting two “series” when the only difference are uppercase characters. New in v1.4
  • chart: “bar” for bar chart, “col” for column chart, “pie” for pie chart or “table” for a plain table.
  • height: Height in pixels
  • width: Width in pixels

Regarding free input
If you leave the attribute “a” as an empty array, the user can supply free text as “answer”. When using free input, the result are automatically presented as a table.

Download code

The code for the file “PollForSharePoint.js”:
Download code from this location

Ask if anything is unclear.

Alexander

Convert a standard SharePoint lookup column to a full blown cross site lookup using javascript only

I have updated the tool described in this article with some new functionality.

The functionality i will describe here is the ability to convert a standard SharePoint lookup column to a cross site lookup column using javascript/jquery only!

Download the script from the above referred article. Create a Lookup column in your list and have it point to the actual list it is created from (it is in fact not relevant what list you point it towards). Load the script from the above described article and select your list:

Images

IMG


Select the list
IMG


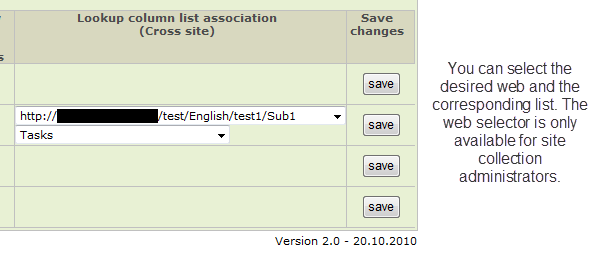
Modify the web and list association and hit “Save”:
IMG

NOTE: The web selector is only available for site collection administrators.

If you are a non site collection administrator, you may change the list association, but not the web association.

This method requires NO modification to the field schema and is fully compatible with Data sheet view etc.

I have not had the chance to test it in SharePoint 2010 yet, but i can see no reason why it should not work.

Alexander

Interactive Charts using Google Visualization API v2.0

You find v3 of this tool here


16.08.2011 I have released version 2.9.3. Read about it here


05.06.2011 I have released version 2.9.1. Read about it here


05.05.2011 I have released version 2.8.5. Read about it here


27.03.2011 I have released version 2.8 featuring different filtering methods. Read about it here


*** See bottom of article for change log on older versions ***


Since i posted the previous version of the solution that utilizes the Google Chart Tools / Interactive Charts (aka Visualization API), Google has updated their API and made the previous version more or less obsolete.

NOTE:
I have made a “bridge” between Google’s Visualization API and SharePoint. How the charts render or function it up to Google to decide – it is their “product”. Refer the various configuration options by following the link from the “Edit chart UI”.

Read Google’s terms of Use here.

Google’s Data Policy on this charts
All code and data are processed and rendered in the browser. No data is sent to any server.

This new release features these chart types:

Other modifications made:

  • All code in one file: “ChartUsingGoogleVisualizationAPI.js”
  • In the CEWP: Refer the above file, jQuery (fixed external link) and the Google jsapi (fixed external link)
  • Chart configuration list is automatically created if it is not already present

The solution is tested in IE8, Google Chrome 5.0.375.127 and Firefox 3.6.8.

Some screenshots (from v2.0 – changes introduced in subsequent versions are not reflected her):

Not all chart types are presented.
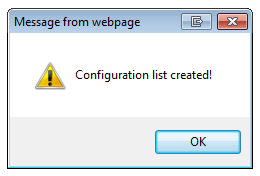
When first adding a chart CEWP to a site, the configuration list is created:

Press OK:

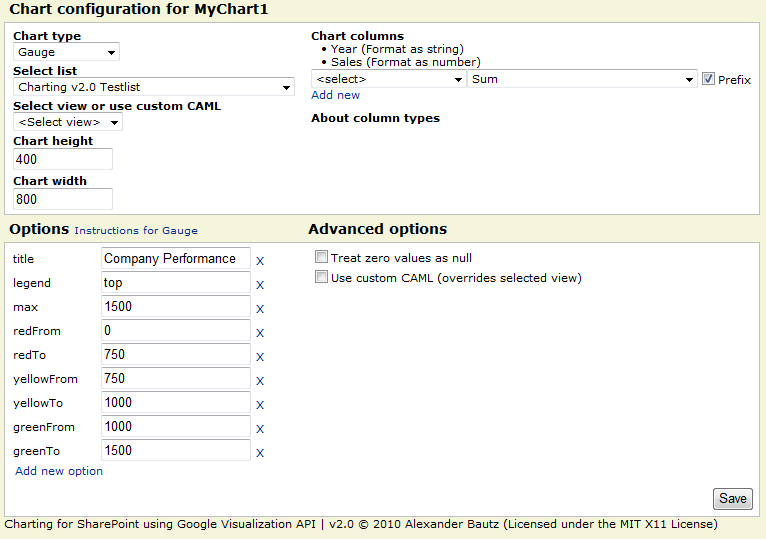
Gauge – a good KPI:

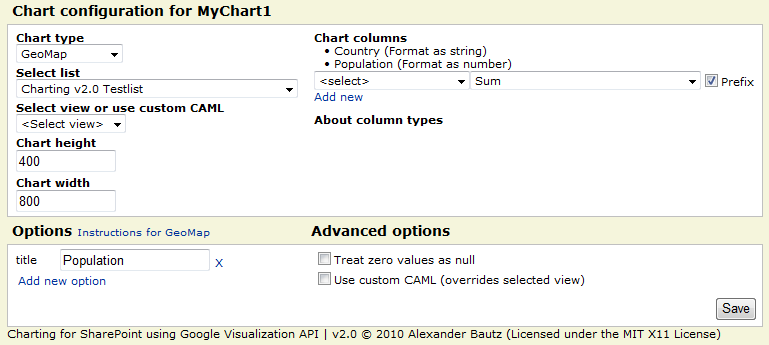
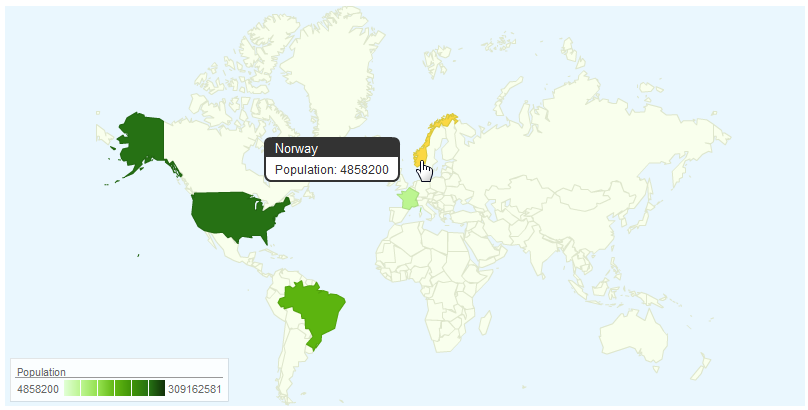
GeoMap:

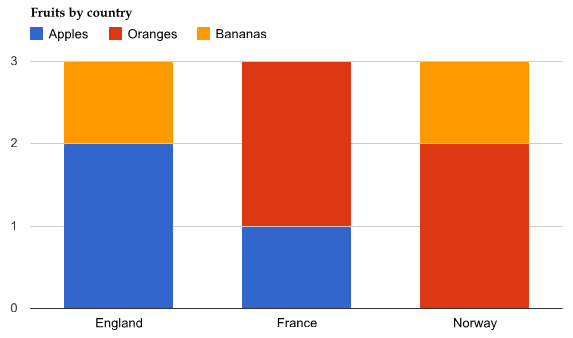
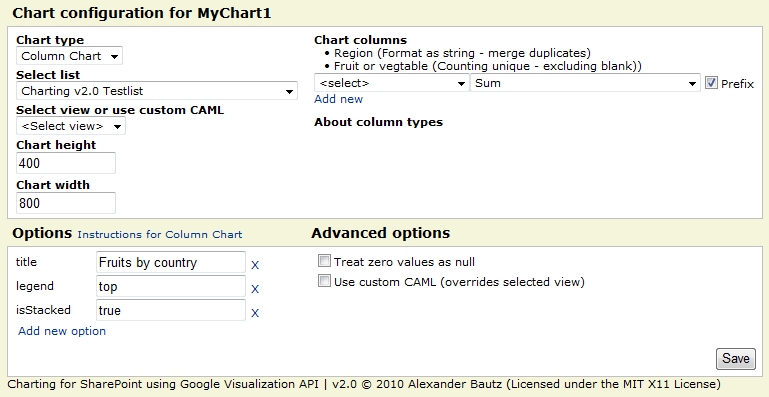
Column chart – counting unique values per country:


This chart type merges all “lines” where the country is the same, counting “fruits” in the choice column named “Fruit or vegetable”.

LineChart:

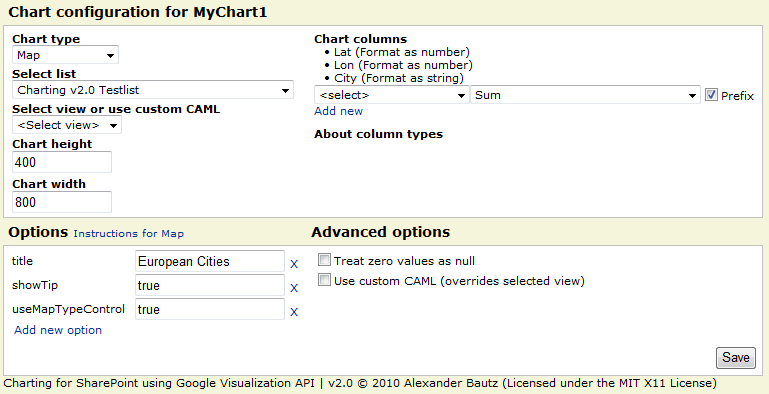
Map:

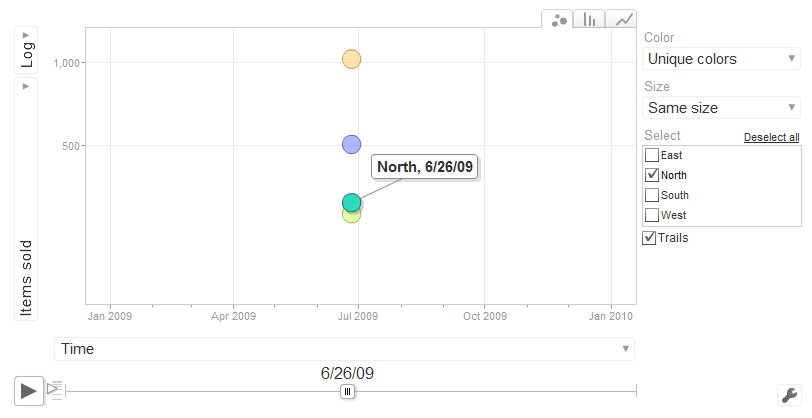
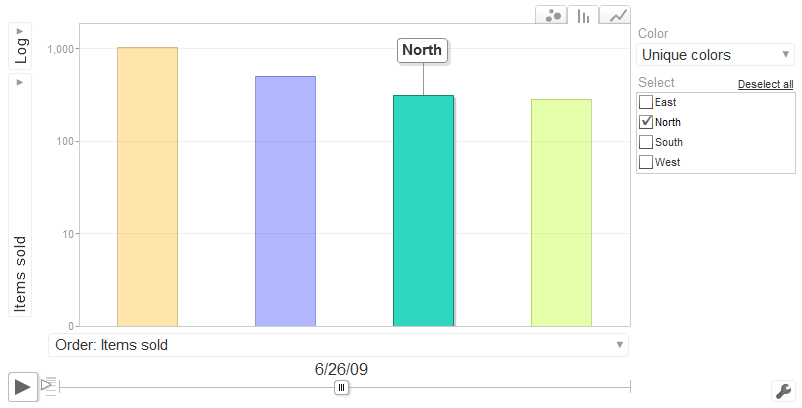
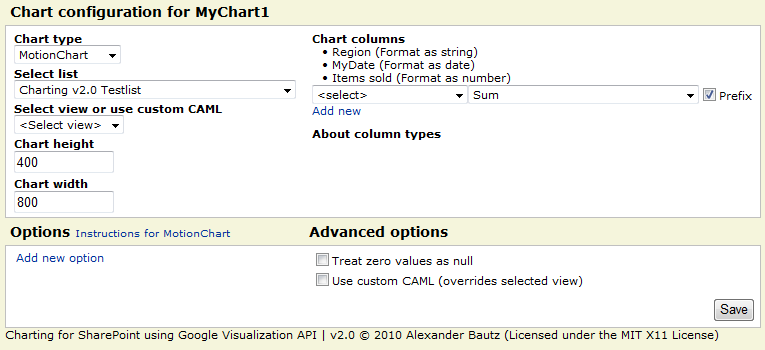
Motion Chart:


The “date” column can be a SharePoint data-column, or a “US formatted” string (still formatted as “Date in the UI”) in the format “mm/dd/yyyy”. Refer the “Instructions for MotionChart” link in the UI.

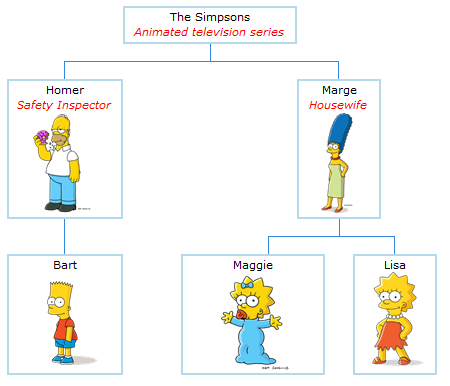
Organizational Chart:


This is the data that makes up this chart. Note that it is built with various calculated columns – no need for it to render as HTML in the list – it is “raw data”.

PieChart:

More examples – including custom CAML-queries will be added on request.


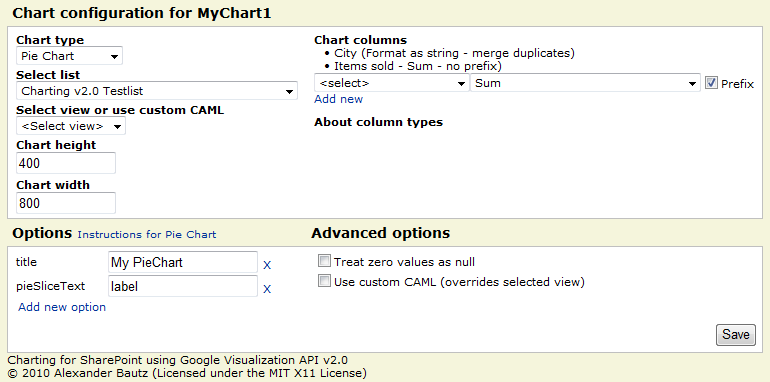
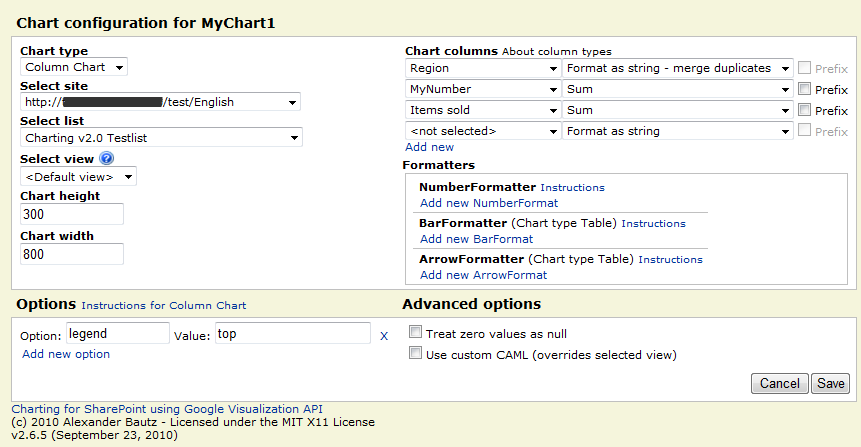
The new GUI from v2.6.5 (introduced in v2.5)


The Code:

This is the CEWP code:

&lt;div id=&quot;MyChart1&quot;&gt;&lt;/div&gt;
&lt;script type=&quot;text/javascript&quot;&gt;
/*****************************************************
		Address all containers
*****************************************************/
// All charts must be represented by a container with a unique id. This container  must be present in the page
arrOfChartContainers = [&quot;MyChart1&quot;];
&lt;/script&gt;
&lt;script type=&quot;text/javascript&quot; src=&quot;http://ajax.googleapis.com/ajax/libs/jquery/1.4.2/jquery.min.js&quot;&gt;&lt;/script&gt;
&lt;script type=&quot;text/javascript&quot; src=&quot;http://www.google.com/jsapi&quot;&gt;&lt;/script&gt;
&lt;script type=&quot;text/javascript&quot; src=&quot;/test/English/Javascript/ChartUsingGoogleVisualizationAPI.js&quot;&gt;&lt;/script&gt;
Note the <div id=”MyChart1″></div> This is the chart “placeholder”. To add more charts, add more placeholders and add them to the array “arrOfChartContainers”.

The placeholders can be inserted in other CEWP’s as long as they render before the chart is initiated (place them above the “Chart CEWP”).

It is essential that the scripts tags for “jsapi” and “ChartUsingGoogleVisualizationAPI.js” are placed below the script tag that defines the “arrOfChartContainers”.

The code for the file “ChartUsingGoogleVisualizationAPI.js”:

Download code from this location

This link can contain different “versions”:

  • ChartUsingGoogleVisualizationAPI_vX.Y.Z.js – Uncompressed code
  • ChartUsingGoogleVisualizationAPI_vX.Y.Z-min.js – Minified using YUI Compressor to reduce the file size
  • ChartUsingGoogleVisualizationAPI_vX.Y.Z-packer.js – Compressed/obfuscated using Dean Edward’s Packer to further reduce the file size

You must update the script name in the CEWP to reflect the version number.

Note:

When new versions are released, they will be placed in a folder with the version number as label. Be sure to download the latest version.

If you are using a browser other than IE, right click the file and select “Save link as” or “Save linked content as…”.

Tip:

To make it convenient for end users to use this charting tool, create a few CEWP’s with your favorite setup (1 placeholder, 4 placeholders in a table form and so on). Export the CEWP and upload it to your web part gallery (in the root of the site collection).

You can now add it as a regular webpart from the “web part selector” in edit page mode.

Enjoy!
Alexander


Change log:

27.03.2011 : New features are described here

19.10.2010 v2.7 is released. You find it in the “download section” above This version is the final fix (i hope…) for the web selector problems for non Site Collection Administrators (SCA).

For SCA’s there are no changes, but for those not SCA, I have abandoned my attempt to auto populate a web selector and gone for a input field. The user must write the URL of the web to load the list collection from. The reason for this is the fact that the method “GetAllSubWebCollection” is not accessible to non SCA’s, and that the manual iteration trough all webs caused prompts for credentials as it hit webs the current user did not have access to.
You will still get a credential prompt if you try to load the list collection for a web you have no rights to, but you will not get stuck in a “endless” loop of credential prompts.

New features:
In this version i have added the option to restrict edit access for a individual chart to a specific SharePoint user group. You find this setting in the Advanced option area in the “Edit Chart GUI”:

This is no “real” security setting as it only skips the rendering of the “edit chart button” and does not restrict the edit rights to the chart configuration list. If you want a true security setting you must change the permissions for each “chart” in the configuration list, or the permission for the configuration list itself.

Important!

v2.7 requires you to add one column of type “Single line of text” to the chart configuration list. The name of the field must be exactly “EditAccessGroupID” (without the quotes). Optionally you can delete the configuration list and have the script recreate it. The latter will result in you loosing all your existing chart configurations.


05.10.2010 v2.6.5 unintentionally made it impossible for other than site collection administrators to select web. This update (v2.6.6) fixes this issue. For uses that are not site collection administrators, the loading of the web selector may take a few seconds extra.

The check for edit page rights has been removed due to feedback from users that had problems editing charts. To restrict editing of the charts, manage user right for the configuration list – all users must have at least read access!

28.09.2010 Still some issues with the web selector as the v2.6.5 unintentionally made it impossible for other than site collection administrators to select web. I’m working on an updated version that will fix this. In the meantime, use v2.6.4 if you are not on a managed path…

23.09.2010 A new release (v2.6.5) has been added to the download section. This intends to fix the empty web selector for users with site collection on a managed path.

22.09.2010 There are some unresolved issues with the current release. You can follow the progress in the comment section below.

19.09.2010 A new version (2.6.1) is added to the “download section” – see bottom of article. It features enhanced functionality for selecting web. It now let you pick freely from all sites within the site collection (siblings, parent sites and subsites). This version may contain bugs, so please let me know if you find any.

14.09.2010 Small update to the code to fix the “Initial state” in motion charts, as well as some minor bug fixes. I have moved the files to my home server for you to download. This provides a better solution then manually highlighting and saving 2000+ lines of code. Please note that the file now come in three different “versions”. Read more in the “download section” below.

09.09.2010 Small update to the description regarding update from v2.0 to v2.5. I forgot to mention another field required to be added to the Chart configuration list: ListBaseUrl. This in addition to the already mentioned “ChartFormatters”. I have also removed an alert that was left in the code (line 40).

Christophe notified me of a problem with the 2010 compatibility in sub-site “homepage” – which is a wiki page. The CEWP HTML handling in SP2010 is a bit “different” than in SP2007. When editing the HTML source code, it actually pulls the contents generated by the script into the edit dialog and does not use the content that was originally saved to the CEWP… This is a bit of a headache!. A workaround for the wiki-pages is to use the “Content Link” property for the CEWP and link to a .txt file with the CEWP code placed in a document library (alongside the other scripts).

06.09.2010 Updated the script “ChartUsingGoogleVisualizationAPI.js” and the CEWP code. The version number is notched up to 2.5 and the changes are:

  • Added the ability to chart data from all ascending parent sites and all first level subwebs of current site
  • Added a few formatter options in the UI – refer the linked resources for instructions (thanks to Paulo for the tip).
  • Added new “action” for formatting as % (value*100).
  • The solution is now SharePoint 2010 compatible
  • Enhanced the UI for editing charts – all options and columns are now directly editable.
  • No more need to specify the “userListGuid” and the “userListBaseUrl” in the CEWP code.
  • The naming of the charts in the Chart Configuration list is enhanced – it now prefixes the chartId with “location.pathname” to prevent overwriting an existing chart when reusing the CEWP code in another page (thanks to Christophe for the tip).
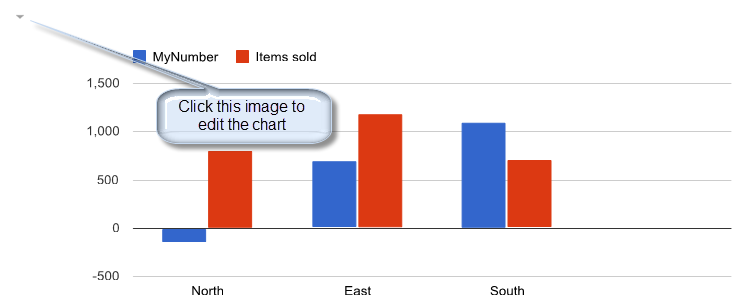
  • Edit chart is now done in the standard “Browse mode” and not in “EditPage mode”. The edit button is found in the top left corner of the chart. The button is only visible for users with “Edit page rights” and does not show on printouts.
  • And more…

Note: This update introduces two new columns in the configuration list (GoogleVisualization_InteractiveChartsConfig). To reuse the existing Chart configuration list you must add one field of type “Multiple lines of text (Plain text) named “ChartFormatters” and one field of type “Single line of text” named “ListBaseUrl”. Optionally you can delete the Configuration list and have this solution automatically recreate it for you.

Please note that the CEWP code has changed alongside the code for the file “ChartUsingGoogleVisualizationAPI.js”.

Note about existing charts:
All your existing charts will need to be updated with the new “page id” in the chart configuration list (GoogleVisualization_InteractiveChartsConfig). Look at the new configuration item that is automatically added – copy it’s name and update your existing chart configuration – while deleting the newly added (empty) chart configuration.

27.08.2010 Small update to the file “ChartUsingGoogleVisualizationAPI.js” to fix a formatting issue when using object literal notation in the chart options.