SPJS Charts for SharePoint v6 can be found here
I published the first version of the SPJS Charts for SharePoint back in 2010, and released the current v4 version well over 2 years ago.
After being neglected for far to long, I’m happy to finally release v5 of SPJS Charts for SharePoint in a BETA version.
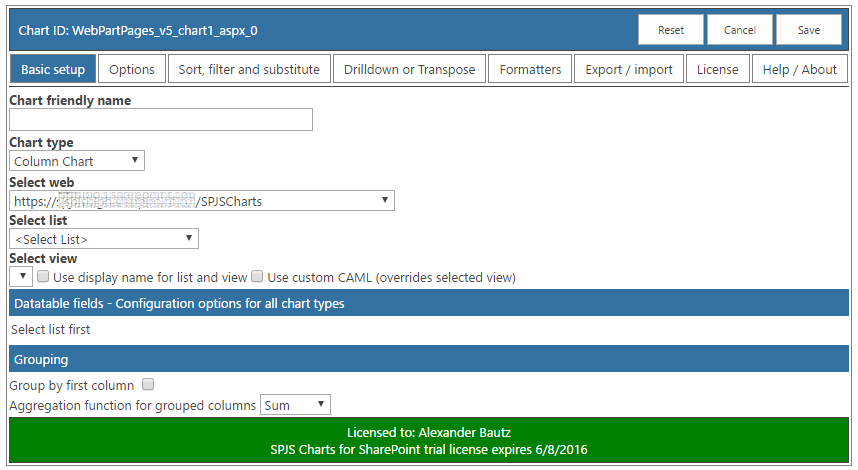
This version has been brushed up quite a lot, and supports most of the chart types available in the Google chart solution.
I have also added support for basic drill-down, transpose and a few other new features. It still supports all SharePoint versions, but I have not been able to test it in SP 2007 – feedback is appreciated.
This new version will not interfere with v4 of SPJS Charts for SharePoint (uses a separate configuration list), but you cannot use v4 and v5 in the same page. You cannot currently import existing charts from v4, but this might be added as an option if there is demand for it.
There is no trial period built in, but you can request a 1-3 month trial by following the link in the banner below the chart.
Follow these simple steps to install
- Download the files form here
- Unzip, and upload to a document library named “SPJS”. The folder structure should be “/SPJS/Charts/”.
- Edit the file “SPJSChartsMaster_CEWP.html” to correct all the links to the various scripts.
- Copy the path to the file “SPJSChartsMaster_CEWP.html” and insert the link in the Content link field in a Content Editor Web Part (CEWP) in a page in your site.
Localize the frontend UI
You can edit the file “/SPJS/Charts/js/spjs-charts-i18n.js” to add your own translation for the labels and messages in the frontend UI.
User manual
The user manual is not yet complete, but you find it here.