v1.2 has these changes:
Fixed bug where the string representing the “tile” in the org chart exceeds 255 characters and thus halting the script. This is fixes by using a multiline text field in stead of the Title field in the list “SPJS-SiteMap”.
You find the updated code below.
Updating from a previous version?
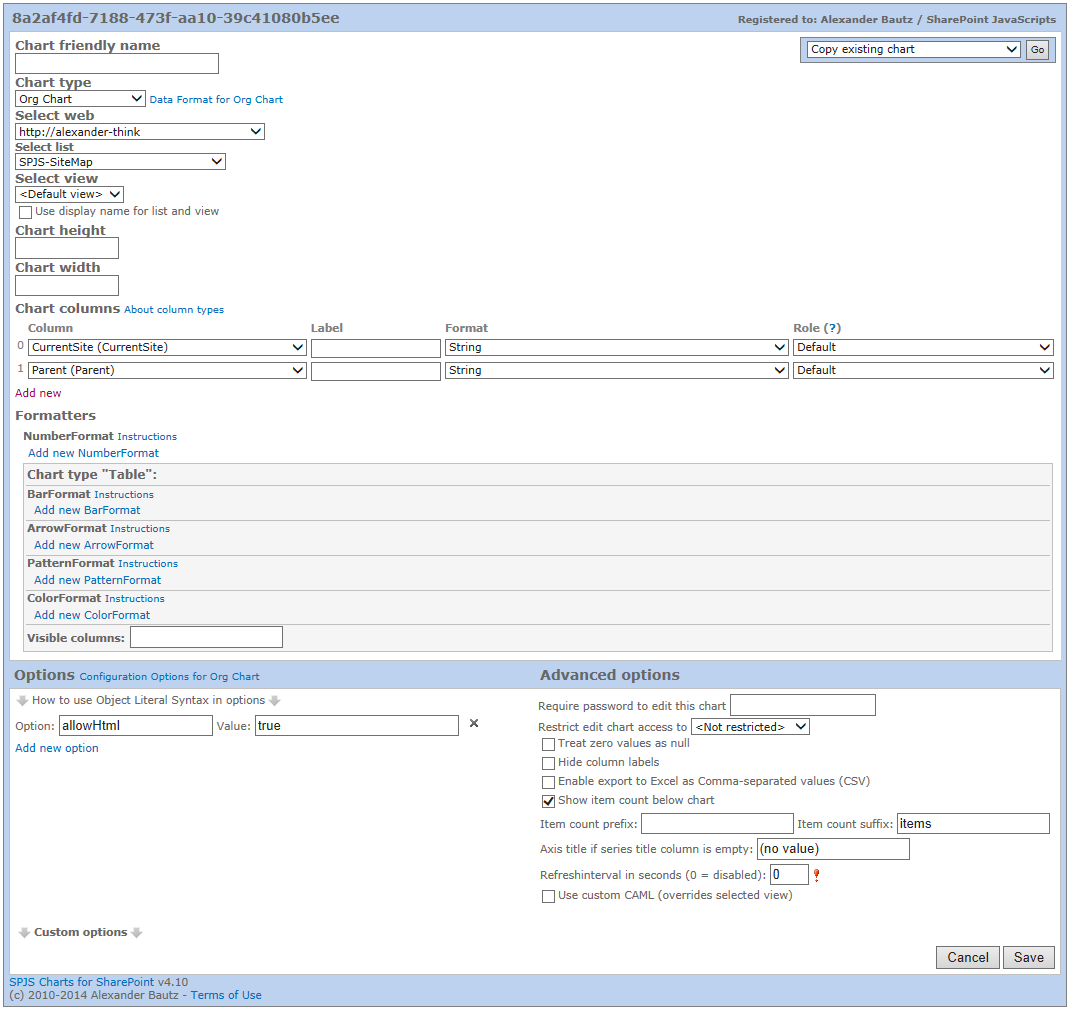
Please note that you must delete the existing list and rerun the script to recreate it with the new fields. When the script has recreated the list, you must enter setup of your chart to reselect the list and fields for your SiteMap chart. See image below for changes in the chart setup (new field used in stead of the Title field).
@SPJavaScripts do you have something that makes a site map? Using the logged in perms instead of having to be a site col admin would be nice
Unfortunately I do not know of a method of doing this without Site collection Administrator (SCA) rights, but thought I should post a solution anyways. This solution iterates trough all sites in the site collection and writes to a custom list in a format that can be rendered as a clickable organization chart using SPJS Charts for SharePoint.
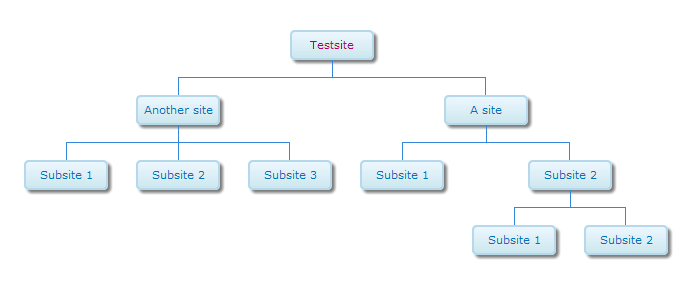
The map must be created or updates by a SCA, but can be read by all users.
- Set up SPJS Charts for SharePoint v4 as described here. Please note that you need v4.03 or later.
- Download spjs-utility.js from here and save it in a document library or a folder created in SPD.
- Create a Web Part Page and add a HTML Form Web part to it. Add the code from the code block below in the source editor.
You can also use a CEWP if you use the content link option to link to the code. Do not add the code directly in the source editor of the CEWP.
- Download jQuery from here.
When you reload the page, you will see a button named “Add or update site map”. Click this to set up the list. You should get a confirmation message when the list has been created. You need appropriate permissions to add a list. If you are a SCA, go ahead and populate the list with information about all sites in the site collection. This is done by clicking the same button again.
You will get a confirmation message with the count of items added, updated and removed. The information in the list SPJS-SiteMap is now static and will not reflect changes in the site structure live. To update the site map when a site has been added / updated or removed, an SCA must click the button “Add or update site map” again.
You must update the script src to point to your local files.
<div id="siteMapBtn"></div>
<script type="text/javascript" src="/Scripts/jquery-1.10.2.min.js"></script>
<script type="text/javascript" src="/Scripts/spjs-utility/spjs-utility.js"></script>
<script type="text/javascript">

var spjs = spjs || {};

spjs.siteMap = {
	"version":"1.2",
	"data":{
		"listName":"SPJS-SiteMap",
		"listBaseUrl":typeof _spPageContextInfo !== "undefined" ? _spPageContextInfo.siteServerRelativeUrl !== "/" ? _spPageContextInfo.siteServerRelativeUrl : "" : L_Menu_BaseUrl,
		"listDescription":"SPJS-SiteMap for SharePoint by Alexander Bautz / SharePoint JavaScripts: https://spjsblog.com. This list is used as datasource for SPJS Charts for SharePoint."
	},
	"showButton":function(){
		$("#siteMapBtn").html("<input type='button' onclick='spjs.siteMap.update()' value='Add or update site map' />");
	},
	"update":function(){
		if(!confirm("You must be Site Collection Administrator to add or update the site map. Click OK to continue.")){
			return;
		}
		var b, webs, thisBaseUrl, p, currItems, currItemsObj, newList, uList, data, res, noChangeCount, uCount, nCount, dCount, error;
		b = '<GetAllSubWebCollection xmlns="http://schemas.microsoft.com/sharepoint/soap/" />';
		webs = {};
		spjs_wrapSoapRequest(spjs.siteMap.data.listBaseUrl+'/_vti_bin/webs.asmx', 'http://schemas.microsoft.com/sharepoint/soap/GetAllSubWebCollection', b, function(data){
			$('Web', data).each(function(i,o){
				thisBaseUrl = $(o).attr("Url").replace(location.protocol+"//"+location.host,"");
				if(thisBaseUrl === ""){
					thisBaseUrl = "/";
				}
				p = $(o).attr("Url").replace(location.protocol+"//"+location.host,"");
				p = p.substring(0,p.lastIndexOf("/"));
				if(p === ""){
					p = "/";
				}
				webs[thisBaseUrl] = {"title":$(o).attr("Title"),"parent":p};
			});
		});
		// Get current items
		currItems = spjs_QueryItems({"listName":spjs.siteMap.data.listName,"listBaseUrl":spjs.siteMap.data.listBaseUrl,"query":"<Where><IsNotNull><FieldRef Name='ID' /></IsNotNull></Where>","viewFields":["ID","CurrentSite","Parent","URL"]});
		if(currItems.count === -1){
			if(confirm("It looks like the list named "+spjs.siteMap.data.listName+" does not exist.\n\nCreate it now?")){
				newList = spjs_AddList(spjs.siteMap.data.listName,spjs.siteMap.data.listBaseUrl,spjs.siteMap.data.listDescription);
				if(newList.success){
					uList = spjs_UpdateList(newList.id,L_Menu_BaseUrl,[{'Type':'Note','DisplayName':'CurrentSite'},{'Type':'Note','DisplayName':'Parent'},{'Type':'Note','DisplayName':'URL'}],[]);
					if(!uList.success){
						alert(uList.errorText);
						return;
					}else{
						if(confirm("The list was created successfully. Click OK to populate the list.")){
							spjs.siteMap.update();
						}
					}
				}else{
					alert("[spjs_AddList]\n\n"+newList.errorText);
					return;
				}
				return;
			}else{
				return;
			}
		}
		currItemsObj = {};
		noChangeCount = 0;
		uCount = 0;
		nCount = 0;
		dCount = 0;
		$.each(currItems.items,function(i,item){
			currItemsObj[item.URL === null ? "" : item.URL] = {"ID":item.ID,"CurrentSite":item.CurrentSite,"Parent":item.Parent,"URL":item.URL};
		});
		error = false;
		$.each(webs,function(url,o){
			data = {"Title":"[...]","CurrentSite":"{\"v\":\""+url+"\",\"f\":\"<a href='"+url+"' target='_blank'>"+o.title+"</a>\"}","URL":url,"Parent":o.parent}
			if(currItemsObj[url] !== undefined){
				if(currItemsObj[url].CurrentSite === data.CurrentSite && currItemsObj[url].Parent === o.parent && currItemsObj[url].URL === url){
					delete currItemsObj[url];
					noChangeCount += 1;
					return;
				}
				res = spjs_updateItem({"listName":spjs.siteMap.data.listName,"listBaseUrl":spjs.siteMap.data.listBaseUrl,"id":currItemsObj[url].ID,"data":data});
				delete currItemsObj[url];
				if(!res.success){
					error = {"errorText":res.errorText,"code":res.errorCode};
					return false;
				}else{
					uCount += 1;
				}
			}else{
				res = spjs_addItem({"listName":spjs.siteMap.data.listName,"listBaseUrl":spjs.siteMap.data.listBaseUrl,"data":data});
				if(!res.success){
					error = {"errorText":res.errorText,"code":res.errorCode};
					return false;
				}else{
					nCount += 1;
				}
			}
		});
		if(error !== false){
			alert("SPJS-SiteMap: An error occurred\n---------------------------------------\nAre you updating from a previous version? If the below error message tells you that one or more field types are not installed correctly, please delete the list \"SPJS-SiteMap\" and rerun this script. The list will be recreated with the missing fields.\n\nPlease note that you must edit the SiteMap chart to reselect the list and fields.\n\nError message\n---------------------------------------\n"+error.errorText);
		}
		$.each(currItemsObj,function(url,obj){
			res = spjs_deleteItem({"listName":spjs.siteMap.data.listName,"listBaseUrl":spjs.siteMap.data.listBaseUrl,"id":obj.ID});
			if(!res.success){
				alert("[spjs.siteMap]\n\n"+res.errorText);
				return false;
			}else{
				dCount += 1;
			}
		});
		alert("SPJS-SiteMap\n\nUpdated: "+uCount+"\nAdded: "+nCount+"\nRemoved: "+dCount);
		location.href = location.href;
	}
};

spjs.siteMap.showButton();
</script>
Refer the SPJS Charts for SharePoint v4 article for setup instructions, and select the list “SPJS-SiteMap” as data source. Add an option “allowHtml = true” to render the links as HTML. Here is a screenshot of the Edit Chart GUI:
Let me know what you think of this solution in the comments section below.
Alexander
Hi Alexander,
Thank you very much for creating this code, I just implemented it on one of our Site Collections in MOSS2007 and it worked a treat. Oddly the .js code for the site map above and the spjs_chartPlaceholder.txt file had to be uploaded into the Site Collection where I wanted to use them whilst the spjs-charts-v4.js and spjs-utilities.js, as well as our local version of jquery, were accessed from the top level portal that owns all of our site collections and where we store all such code used throughout.
Regards,
David
Hi Alexander,
I hope you had a good Christmas and enjoy the New Year celebrations. I’ve just used the site-map code on another site collection and when clicking the ‘Add or Update site map’ button it comes up with the following error “Invalid Text Value: A text field contains invalid data. Please check the value and try again”. The resulting output is missing quite a few sites I am aware of that are in the site collection. Can you advise what the invalid data might be referring to?
Regards,
David
Hi,
I guess the URL is to long for the Title field (255 characters). I’ll update the solution to use another field as the Title field cannot be changed to a multiline plain text filed.
I’ll put it on my todo list, but if you want to fix it yourself, add a plain text multiline field to the list “SPJS-SiteMap” and change any references to “Title” in the code to this new field.
You must also change the chart to use this new field in stead of the Title field.
Alexander
Thanks for the suggestion Alexander, I’ve added a multiple line plain text column to the list and amended the code to replace ‘Title’ with the new column name. The chart is showing the correct number of sites in the total at the bottom now but has ‘Invalid Property Value’ in a red background box instead of the map itself. I set the new column to format ‘String’ in the Chart control dialogue screen, is that correct?
Regards,
David
Hi,
Sorry, but I do not have the time to look at it now. I will redo the code as soon as I can manage. You may want to look at the contents in the new column and look for special characters that could mess up the syntax.
Alexander
Alexander, I appreciate you help. It looks like there is something else in you code that I need to change to use the new column.
The value of one list record in the original ‘Title’ columns is: –
{“v”:”/teams/GlobalCommunities”,”f”:”Global Communities“}
and in my new column it is: –
{“v”:”/teams/GlobalCommunities”,”f”:”undefined“}
The ‘undefined’ piece is probably what is causing the problem, it is the same out put value in all the records.
Happy New Year, when you get there in your timezone,
David
Hi,
Did you see the updated code?
Alexander
Hi Alexander,
Happy New Year.
Thank you I’ve implemented the new code, it is correctly reporting the number of sites, the ‘CurrentSite’ column is displaying everything properly now and I can’t see any special characters but am still getting the ‘Invalid Property Value’ in a red background box instead of the map itself.
I’ve downloaded, and am using, the latest version (4.05) of spjs_charts_v4 which I re-added to the page after deleting the original CEWP with link to the placeholder code. On reconfiguring I added the ‘Chart Columns’ CurrentSite and Parent but when I go back into the configuration screen a blank additional Chart Column has appeared with a format of ‘Average’!
Regards,
David
Hi,
The additional column is not active as long as it is blank. This is expected to be there, but is missing in my screenshot as it had not been saved yet.
Send me screenshots of the chart configuration and the error. If possible also send the contents of the SPJS-SiteMap list in a Excel workbook.
You find my email here: https://spjsblog.com/about/
Alexander
To David and others experiencing the error “Invalid property value” in org charts when using Internet Explorer.
I have investigated a bit and it seems Internet Explorer is unable to display org charts when they span more than 1000 table columns (the org chart is built as a table).
This is out of my control, and the only possible workaround is to use another browser like Chrome or Firefox.
Sorry about that,
Alexander
Many thanks Alexander, works wonderfully in Firefox.
Regards,
David
Hi again Alexander,
I hope you don’t mind but I’ve amended your code slightly to add another column in the SPJS-SiteMap list to include just the link to each sub-site in the site collection. Then using Christophe’s TextToHTML code on the list view page I have a list with links to all subsites which is what I was after. My users can create sub-sites below their own ‘top’ level sites in the site collection and boy do they create them!! As we are due to migrate to 2013 sometime this year we are looking to deleting redundant sub-sites but need to know what is there and if it is needed anymore.
I’ll email you the amended code, look for references to a column called ‘Link’.
Regards,
David
Hi,
Is there a way to make the site list update automatically or would I have to schedule creating the list through powershell or something?
Thanks!
Hi,
If you mean to update the sitemap automatically when a new site is created you must create some kind of server side code that runs on a timer.
This script is client side only and you must hit the button to update the list.
Alexander
Not sure what I’m doing wrong but the button does not create the list to hold the site map data. I see an error “SCRIPT5007: The value of the property ‘spjs_wrapSoapRequest’ is null or undefined, not a Function object ”
I am a site collection admin
Hi,
I suspect you are missing a reference to spjs-utility.js.
Alexander
Wow I feel like a fool! I referenced spjs-utility incorrectly as below. That extra ” will get you every time.
Hi Alex,
This is a wonderful solution!
Is it possible to include the site pages in the site map?
– Bruno
Hi,
Not without modifying the script, also keep in mind that this is not a “live” chart. It has to be built by an administrator and will not update until it is manually rebuilt by an administrator (by hitting the “Add or update site map” button).
Alexander
Thank Alex for your response.
I have implemented this solution for my sharepoint site. I am aware that only Admin can create this site and it is not a live chart.
– Bruno
Is it on purpose that every user can see the subsites of the site map, although they don’t have permissions to some of the sites? How could this be changed?
Hi,
The sitemap is “static” and built by an administrator. You will therefore see all sites that the administrator can see.
There is unfortunately no way to “security trim” this chart.
Alexander