I have updated SPJS Charts for SharePoint to v3.3 and added a few new features.
You find the code in the original article
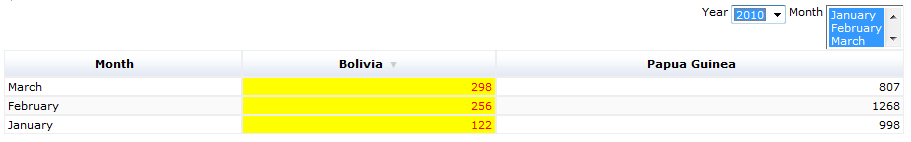
When setting up a chart filter, you now have an option “multiselect” which you can set to true to have multiple selection in the filter select. You can also specify the size of the select. See the “Instructions” link above the filter setup textarea.
Description pulled from here
Assigns colors to the foreground or background of a numeric cell, depending on the cell value. This formatter is an unusual, in that it doesn’t take its options in the constructor. Instead, you should call addRange() or addGradientRange() as many times as you want, to add color ranges, before calling format(). Colors can be specified in any acceptable HTML format, for example “black”, “#000000”, or “#000”.
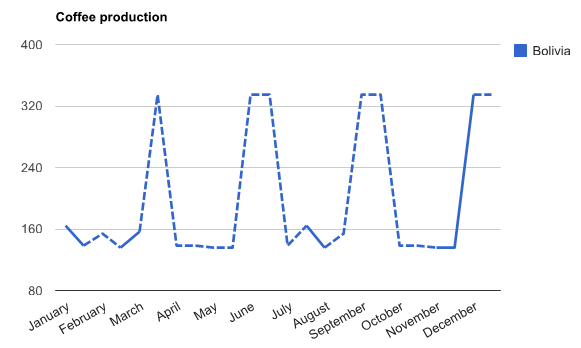
Dotted line represents uncertain numbers.
Description pulled from here
Google DataTable and DataView objects now support explicitly assigned column roles. A column role describes the purpose of the data in that column: for example, a column might hold data describing tooltip text, data point annotations, or uncertainty indicators.
Previously, there were only two roles available to a column: ‘domain’ which specifies major axis labels; and ‘data’ which specifies bar heights, pie slice widths, and so on. These roles were assigned implicitly, based on the order and type of the columns in the table. However, with the ability to explicitly assign column roles, you can now add optional columns that provide new, interesting features to a chart such as arbitrary annotation labels, hovertext, and uncertainty bars.
You can apply the same filter on multiple charts in a page. To do this, add the parameter “filterAdditionalCharts” to the filter setup textarea like this:
[{"label":"Year","urlKey":"year","filterAdditionalCharts":["MyChart2"],"options":[{"f":"All","v":"*"},{"f":"2010","v":"2010"},{"f":"2011","v":"2011"},{"f":"2012","v":"2012"}]}]
You supply an array of additional chart container IDs to apply this filter to. If you set up multiple filters, you only have to set this parameter for the first filter select. In the additional charts, you must set up the Custom CAML to consume the filter values.
Previously there were a problem using boolean options like “sortAscending”. This has now been fixed.
In the “Edit Chart GUI” the field names are now Alphabetically sorted. You also have the FieldInternalName in parentheses behind the display name. This might come in handy when setting up custom CAML.
Google periodically releases a new version of the Google Visualization API. As the API does not have support for versioning, the new version is forced on everyone using this tool. To stay one step ahead, you might want to check out the release candidate before it goes live. To do this, you can set the variable “loadRC” to true in the CEWP code (as before), or you can now use a query string parameter in the URL like this:
../MyPage.aspx?loadRC=1
Alexander
Hello Alexander,
I have followed your directions in setting this up and it seems to be OK. However, I am having a problem setting up the pie charts (pie chart does not display )from the simple list that I am testing this with. Any suggestions on how to set up a chart would be helpful. Thanks for your help. I think that my company could use something like this. We are using SharePoint 2007.
capturetheflag
Hello Alexander,
Please delete my first comment. I have solved my problem.
However, would you be able to add ‘Intensity Map’ to list of values in the chart types. Thanks
capturetheflag
Hi. Is it possible to export charts to images or excel, etc?
Hi,
It is possible, but I have not implemented it as it’s not working cross browser. Look at this example: Save Google Charts as images
Alexander
Hi,
We’re having issues with the Map chart and passing name and address to the chart.
The list contains.
Account (their name), Address1, Address2, City, State, Country, Postcode
The error we get is “The columns type does not match the supported data format. See documentation for supported formats”
Which seems to be a common error with google’s chart api.
I can only have two of these columns at a time.
“Postcode, Account” works, but some markers go in the wrong country.
“City, Postcode” Works, but I cannot see the account name on the markers.
Is there anyway to have this Map chart accept the full address along with the name?
Thanks.
Hi,
For better performance (and no room for errors) you should use lat / long pairs to set the exact coordinates. If this is not possible, use the full address in column one, and the “mouseover” in the second column.
If you prefer using the address, piece it together using a calculated column so that you have the full address in a single column.
You have to set the option “showTip” to true to have the tooltip rendered.
Alexander
Hi Alexander,
do you think it’s possible to connect chart with business data catalog in SharePoint?
Thank you in advance
Hi,
I don’t have a solution to that.
Alexander
Hello Alex,
I am creating a dashboard with multiple charts ia a page and when this charts use filtes it seems that they take some time to load and I was looking for a way to have a “loading” message before the charts loads…not sure if you have received some request like this…
Also, I am not sure if put charts on Tabs it is a solution to minimize the render time… I have tries toadjust Easy Tabs with SPJS as I told you before but I am not able to have it working.. not sure but the tabs are not even created.. any sugestions?
Thank you
Renan
Hi,
If you put Christophe’s easy tabs code in a separate CEWP in the bottom right corner of your page, and you have the “Chrome Type” title visible, it should work – I have tested it.
Alexander
Dumb question Alexandre: my page does not have right web part zone.. I have modified to have separated zones but all them are in the main body, one below another. Do you believe it should work if I have included in the bottom of one my webpart zones?
Yes, put it below all other web parts.
Alexander
It seems that if I set Chrome Type for these webparts as “Title Only” it will work, but actually I am having problems with the behavior of the CEWP SPJS codes.
I am trying to have 2 webparts in the same webpart zone, which webpart will receive an CEWP SPJS code, and each code have containers with unique id, so there’s no unique duplicated and when I try to visualize in the view mode it seems that the GUI interface appears from only one of the web parts.
Alex,
Any sugestion for the “loading” content message?
Thank you very much!
I’ll see what I can do in a future release.
Alexander
I am using SPJS_ChartsForSharePoint_v3.3.js and it is working great. However, I have a problem with applying multiple BarFormats to a column in a Table chart.
I have a Number column with index 1. In the “BarFormat” I specify:
Column index: 1 | Option: max | Value: 26
Column index: 1 | Option: min | Value: 18
Column index: 1 | Option: base | Value: 20
Each of the Option/Value pairs above works but when I specify them all, only the last one is applied. I.e. with the sequence above base=20 is taking effect but max=26 and min=18 are ignored.
How do I specify multiple BarFormat instructions for the same column index?
Hi,
I have attempted to fix this issue in v3.3.1. Could you please test it and report back?
Alexander
Hi Alexander,
I have updated to v3.3.1 and it seems to have fixed this issue. I have observed no problems with existing charts after upgrading.
Thank you for the prompt fix!
Martin
Great tool!! I’ve created page with 8 charts, 4 each in 2 columns. All charts in Column A are filtered on filter selection in first chart in the column. The same in Column B, working off filter in first Column B chart. When page opens first chart in Column A and all charts in Column B work and appear normally but charts 2-4 in Column A are blank and display “No items found.”. Reselecting the filter and all of the charts refresh correctly. Any idea what’s going on or what I might do to correct problem?
Hi,
This issue was fixed in v3.3.6 on september 27.
Alexander
Test
Hello Alex,
I have found this script below to have the loading message meanwhile the charts are loaded.
I have included the code for my main CEWP
But as I am using the Christopher solution (Easytabs), and for the others CEWP’s I do not calling the script with the containers, just the tables with the div´s and this solution does not work on the other tabs.
Any ideia here?
Thank you very much!
RS
<script language="javascript"> window.onload = function() { document.getElementById( "site" ).className = "normal"; document.getElementById("loading").className="hide"; } </script>Hi Alexander,
Could you please give me an example of colorFormat option for Table Chart? Here is what i am using and the chart won;t even load.
column Index:3| Option: addRange(from, to, color, bgcolor)| value: (-10, 1, ‘red’, ‘green’);
Thanks,
Manjula
Alexander
Thank you
Hi Alexander
Would you help with an example of how to show data labels (annotations) on the column chart? I have a column chart of Item (x axis) and quantity (y-axis). For readability, I need to show the quantity as a data label on the column.
Hi,
Sorry, but this is not supported by the visualization api.
Alexander
Hi Alex
Can i have detailed steps for implementing “Filter multiple charts with the same filter controls” using
“filterAdditionalCharts”
Regards
JK
Hi!
Have anyone figured this one out yet?
I’m facing the same problem.
To filter multiple charts with one filter, you must enter this in the configuration for your first chart:
“filterAdditionalCharts”:[“MyChart2”]
In “MyChart2” you then use the same CAML as you did for “MyChart1”.
Click the “Filter setup instructions” above the filter setup textarea to read about it.
Alexander
Hi Alex,
How can I sort a table column and also hide that column from view?
Thanks
Rob
Alex,
Can you give me an example of how you hide a column in a table chart.
Thanks
Hi,
It seems the ability to hide a column does not work in the latest version – I will fix this in the next release. If all you want to do is to sort the chart by this column, I suggest you sort the list view you are using as data source (or the CAML if you are using Custom CAML).
Alexander
Thanks Alex