16.08.2011 I have released version 2.9.3. Read about it here
05.06.2011 I have released version 2.9.1. Read about it here
05.05.2011 I have released version 2.8.5. Read about it here
27.03.2011 I have released version 2.8 featuring different filtering methods. Read about it here
*** See bottom of article for change log on older versions ***
Since i posted the previous version of the solution that utilizes the Google Chart Tools / Interactive Charts (aka Visualization API), Google has updated their API and made the previous version more or less obsolete.
NOTE:
I have made a “bridge” between Google’s Visualization API and SharePoint. How the charts render or function it up to Google to decide – it is their “product”. Refer the various configuration options by following the link from the “Edit chart UI”.
Read Google’s terms of Use here.
Google’s Data Policy on this charts
All code and data are processed and rendered in the browser. No data is sent to any server.
This new release features these chart types:
Map | Motion Chart | Organizational Chart | Pie chart | Scatter Chart | Table
Other modifications made:
- All code in one file: “ChartUsingGoogleVisualizationAPI.js”
- In the CEWP: Refer the above file, jQuery (fixed external link) and the Google jsapi (fixed external link)
- Chart configuration list is automatically created if it is not already present
The solution is tested in IE8, Google Chrome 5.0.375.127 and Firefox 3.6.8.
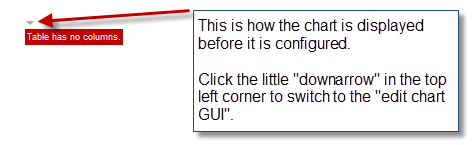
Some screenshots (from v2.0 – changes introduced in subsequent versions are not reflected her):
Not all chart types are presented.
When first adding a chart CEWP to a site, the configuration list is created:

Press OK:
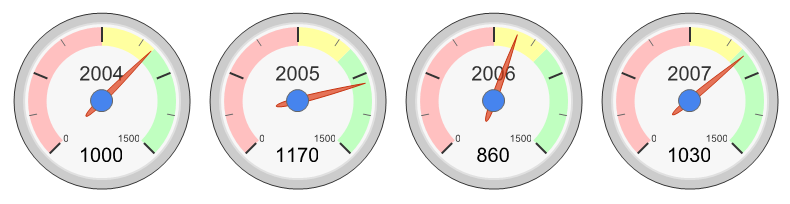
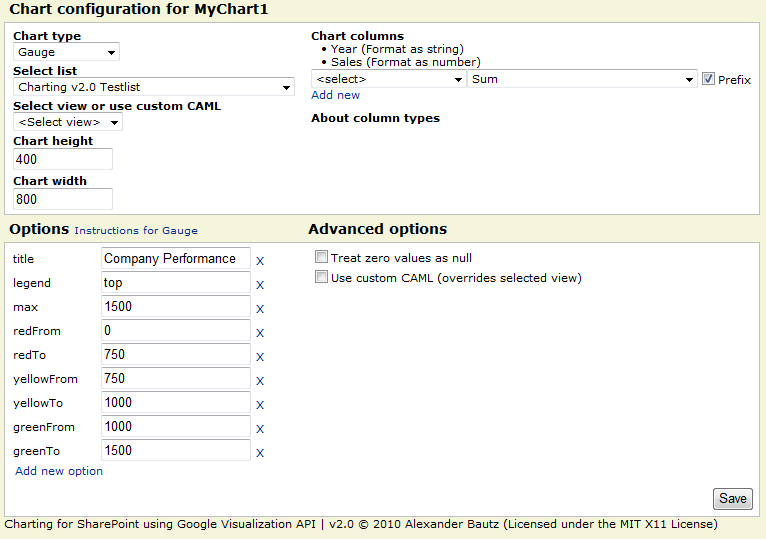
Gauge – a good KPI:
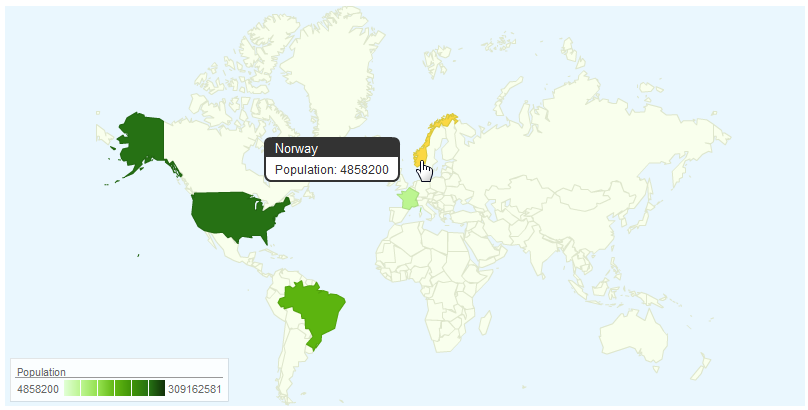
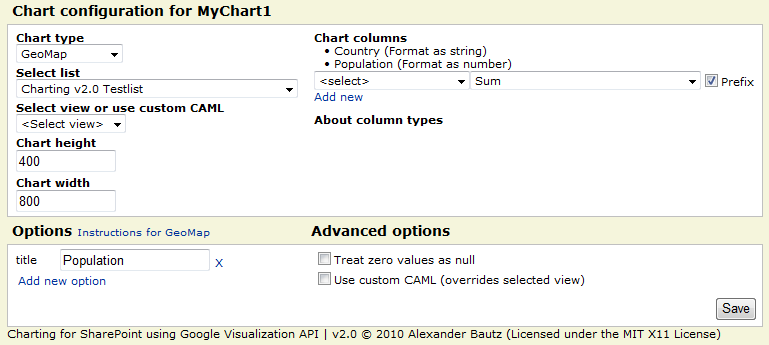
GeoMap:
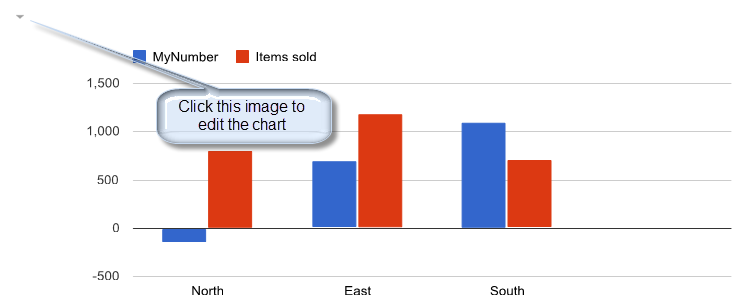
Column chart – counting unique values per country:
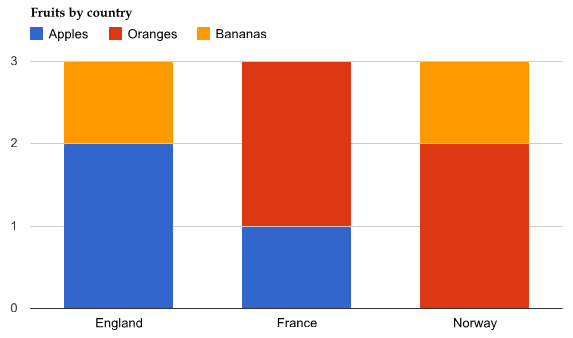
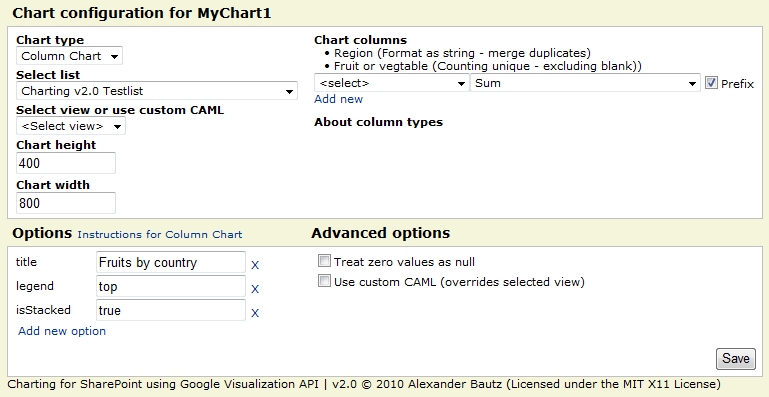
This chart type merges all “lines” where the country is the same, counting “fruits” in the choice column named “Fruit or vegetable”.
LineChart:


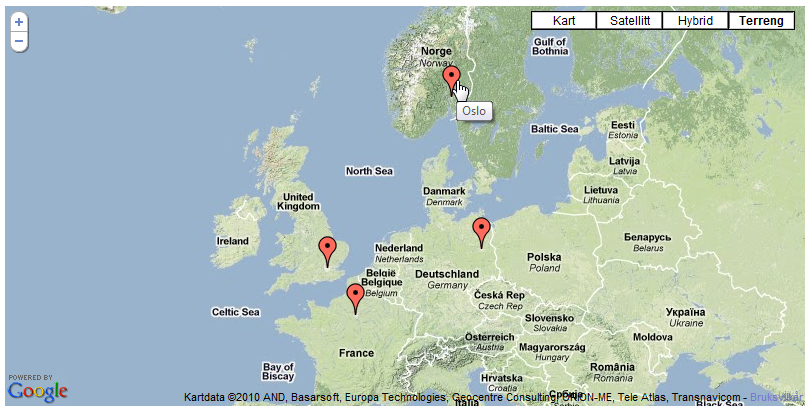
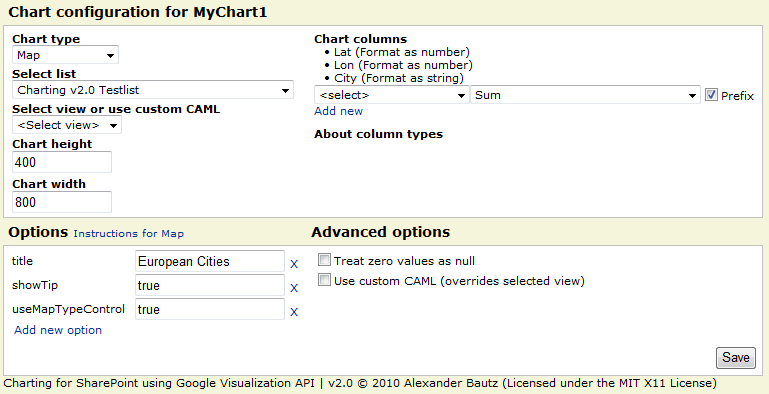
Map:
Motion Chart:
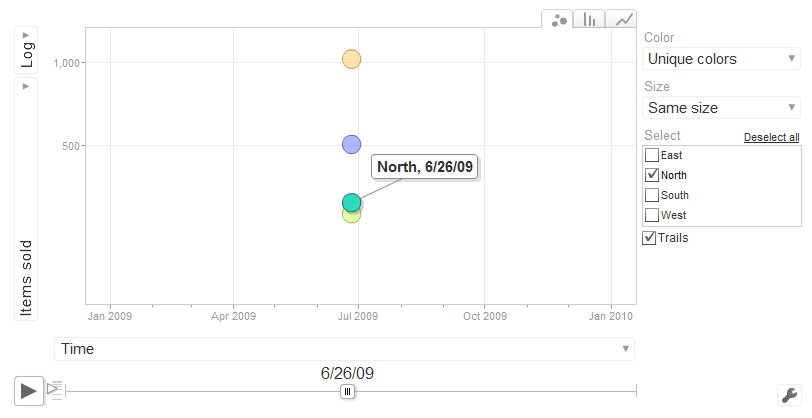
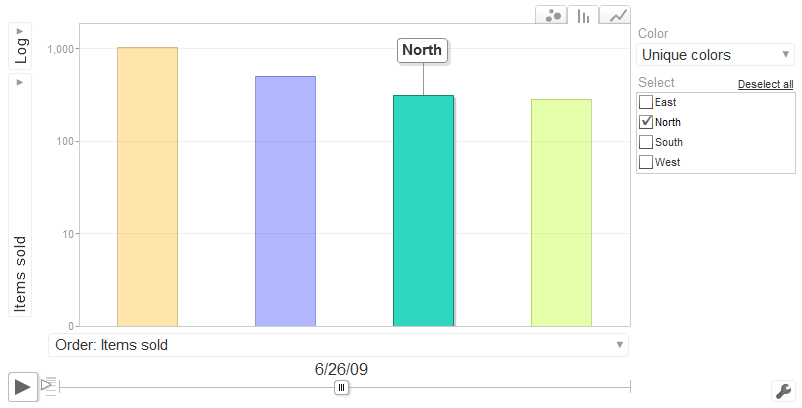
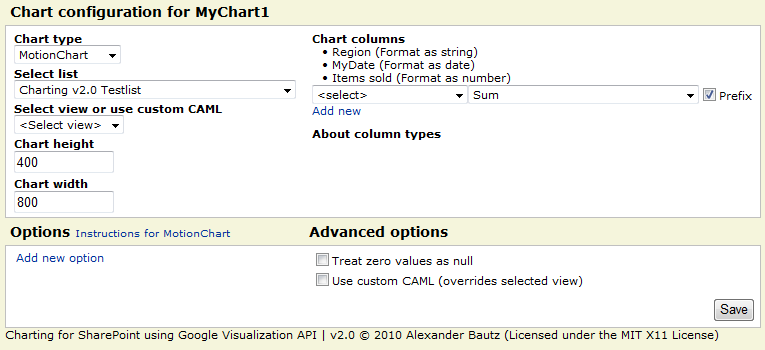
The “date” column can be a SharePoint data-column, or a “US formatted” string (still formatted as “Date in the UI”) in the format “mm/dd/yyyy”. Refer the “Instructions for MotionChart” link in the UI.
Organizational Chart:
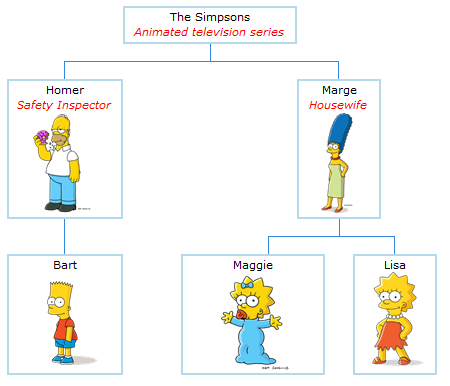

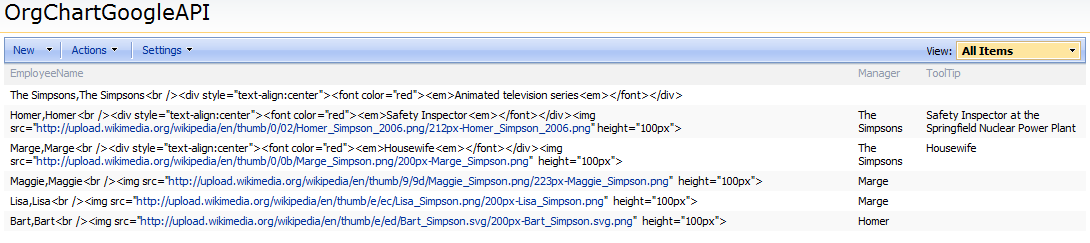
This is the data that makes up this chart. Note that it is built with various calculated columns – no need for it to render as HTML in the list – it is “raw data”.
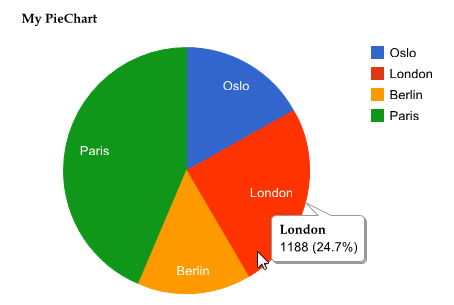
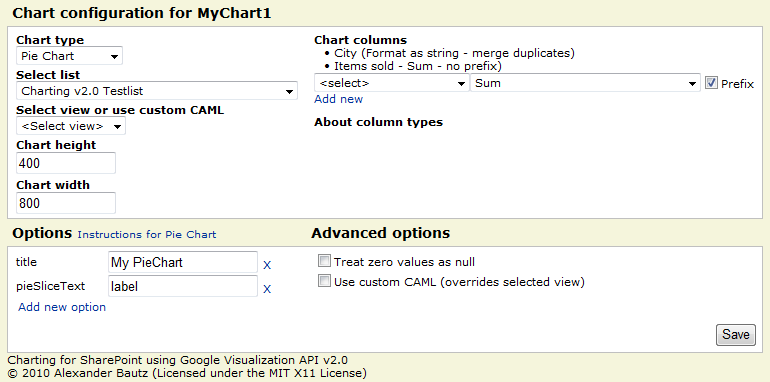
PieChart:
More examples – including custom CAML-queries will be added on request.
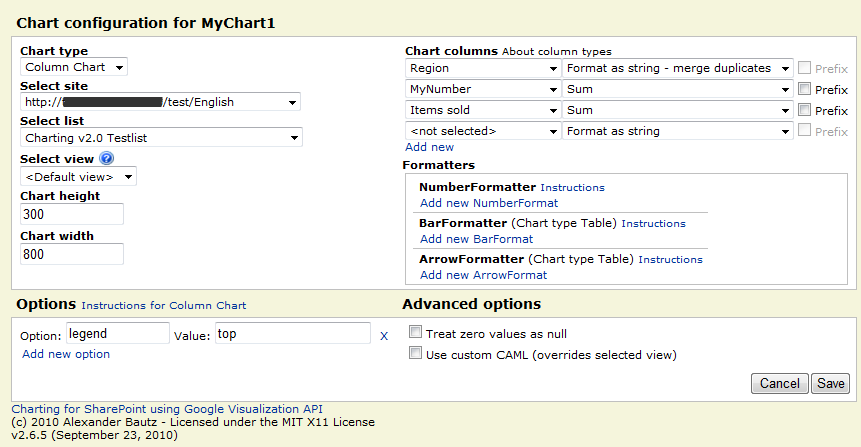
The new GUI from v2.6.5 (introduced in v2.5)
The Code:
This is the CEWP code:
<div id="MyChart1"></div>
<script type="text/javascript">
/*****************************************************
		Address all containers
*****************************************************/
// All charts must be represented by a container with a unique id. This container  must be present in the page
arrOfChartContainers = ["MyChart1"];
</script>
<script type="text/javascript" src="http://ajax.googleapis.com/ajax/libs/jquery/1.4.2/jquery.min.js"></script>
<script type="text/javascript" src="http://www.google.com/jsapi"></script>
<script type="text/javascript" src="/test/English/Javascript/ChartUsingGoogleVisualizationAPI.js"></script>
The placeholders can be inserted in other CEWP’s as long as they render before the chart is initiated (place them above the “Chart CEWP”).
It is essential that the scripts tags for “jsapi” and “ChartUsingGoogleVisualizationAPI.js” are placed below the script tag that defines the “arrOfChartContainers”.
The code for the file “ChartUsingGoogleVisualizationAPI.js”:
Download code from this location
This link can contain different “versions”:
- ChartUsingGoogleVisualizationAPI_vX.Y.Z.js – Uncompressed code
- ChartUsingGoogleVisualizationAPI_vX.Y.Z-min.js – Minified using YUI Compressor to reduce the file size
- ChartUsingGoogleVisualizationAPI_vX.Y.Z-packer.js – Compressed/obfuscated using Dean Edward’s Packer to further reduce the file size
You must update the script name in the CEWP to reflect the version number.
Note:
When new versions are released, they will be placed in a folder with the version number as label. Be sure to download the latest version.
If you are using a browser other than IE, right click the file and select “Save link as” or “Save linked content as…”.
Tip:
To make it convenient for end users to use this charting tool, create a few CEWP’s with your favorite setup (1 placeholder, 4 placeholders in a table form and so on). Export the CEWP and upload it to your web part gallery (in the root of the site collection).
You can now add it as a regular webpart from the “web part selector” in edit page mode.
Enjoy!
Alexander
27.03.2011 : New features are described here
19.10.2010 v2.7 is released. You find it in the “download section” above This version is the final fix (i hope…) for the web selector problems for non Site Collection Administrators (SCA).
For SCA’s there are no changes, but for those not SCA, I have abandoned my attempt to auto populate a web selector and gone for a input field. The user must write the URL of the web to load the list collection from. The reason for this is the fact that the method “GetAllSubWebCollection” is not accessible to non SCA’s, and that the manual iteration trough all webs caused prompts for credentials as it hit webs the current user did not have access to.
You will still get a credential prompt if you try to load the list collection for a web you have no rights to, but you will not get stuck in a “endless” loop of credential prompts.
New features:
In this version i have added the option to restrict edit access for a individual chart to a specific SharePoint user group. You find this setting in the Advanced option area in the “Edit Chart GUI”:
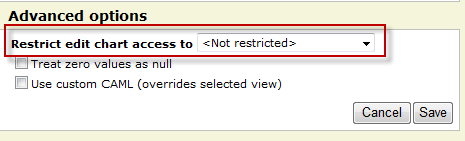
This is no “real” security setting as it only skips the rendering of the “edit chart button” and does not restrict the edit rights to the chart configuration list. If you want a true security setting you must change the permissions for each “chart” in the configuration list, or the permission for the configuration list itself.
v2.7 requires you to add one column of type “Single line of text” to the chart configuration list. The name of the field must be exactly “EditAccessGroupID” (without the quotes). Optionally you can delete the configuration list and have the script recreate it. The latter will result in you loosing all your existing chart configurations.
05.10.2010 v2.6.5 unintentionally made it impossible for other than site collection administrators to select web. This update (v2.6.6) fixes this issue. For uses that are not site collection administrators, the loading of the web selector may take a few seconds extra.
The check for edit page rights has been removed due to feedback from users that had problems editing charts. To restrict editing of the charts, manage user right for the configuration list – all users must have at least read access!
28.09.2010 Still some issues with the web selector as the v2.6.5 unintentionally made it impossible for other than site collection administrators to select web. I’m working on an updated version that will fix this. In the meantime, use v2.6.4 if you are not on a managed path…
23.09.2010 A new release (v2.6.5) has been added to the download section. This intends to fix the empty web selector for users with site collection on a managed path.
22.09.2010 There are some unresolved issues with the current release. You can follow the progress in the comment section below.
19.09.2010 A new version (2.6.1) is added to the “download section” – see bottom of article. It features enhanced functionality for selecting web. It now let you pick freely from all sites within the site collection (siblings, parent sites and subsites). This version may contain bugs, so please let me know if you find any.
14.09.2010 Small update to the code to fix the “Initial state” in motion charts, as well as some minor bug fixes. I have moved the files to my home server for you to download. This provides a better solution then manually highlighting and saving 2000+ lines of code. Please note that the file now come in three different “versions”. Read more in the “download section” below.
09.09.2010 Small update to the description regarding update from v2.0 to v2.5. I forgot to mention another field required to be added to the Chart configuration list: ListBaseUrl. This in addition to the already mentioned “ChartFormatters”. I have also removed an alert that was left in the code (line 40).
Christophe notified me of a problem with the 2010 compatibility in sub-site “homepage” – which is a wiki page. The CEWP HTML handling in SP2010 is a bit “different” than in SP2007. When editing the HTML source code, it actually pulls the contents generated by the script into the edit dialog and does not use the content that was originally saved to the CEWP… This is a bit of a headache!. A workaround for the wiki-pages is to use the “Content Link” property for the CEWP and link to a .txt file with the CEWP code placed in a document library (alongside the other scripts).
06.09.2010 Updated the script “ChartUsingGoogleVisualizationAPI.js” and the CEWP code. The version number is notched up to 2.5 and the changes are:
- Added the ability to chart data from all ascending parent sites and all first level subwebs of current site
- Added a few formatter options in the UI – refer the linked resources for instructions (thanks to Paulo for the tip).
- Added new “action” for formatting as % (value*100).
- The solution is now SharePoint 2010 compatible
- Enhanced the UI for editing charts – all options and columns are now directly editable.
- No more need to specify the “userListGuid” and the “userListBaseUrl” in the CEWP code.
- The naming of the charts in the Chart Configuration list is enhanced – it now prefixes the chartId with “location.pathname” to prevent overwriting an existing chart when reusing the CEWP code in another page (thanks to Christophe for the tip).
- Edit chart is now done in the standard “Browse mode” and not in “EditPage mode”. The edit button is found in the top left corner of the chart. The button is only visible for users with “Edit page rights” and does not show on printouts.
- And more…
Note: This update introduces two new columns in the configuration list (GoogleVisualization_InteractiveChartsConfig). To reuse the existing Chart configuration list you must add one field of type “Multiple lines of text (Plain text) named “ChartFormatters” and one field of type “Single line of text” named “ListBaseUrl”. Optionally you can delete the Configuration list and have this solution automatically recreate it for you.
Please note that the CEWP code has changed alongside the code for the file “ChartUsingGoogleVisualizationAPI.js”.
Note about existing charts:
All your existing charts will need to be updated with the new “page id” in the chart configuration list (GoogleVisualization_InteractiveChartsConfig). Look at the new configuration item that is automatically added – copy it’s name and update your existing chart configuration – while deleting the newly added (empty) chart configuration.
27.08.2010 Small update to the file “ChartUsingGoogleVisualizationAPI.js” to fix a formatting issue when using object literal notation in the chart options.