› Forums › SPJS Charts for SharePoint › Totals row in a table chart
Tagged: DFFS, totals row
- This topic has 16 replies, 2 voices, and was last updated 5 years, 8 months ago by
Alexander Bautz.
-
AuthorPosts
-
-
August 9, 2018 at 09:43 #21729
Phil Grant
ParticipantAlexander,
Sorry but I just don’t understand the option “Show totals row for table chart” I’ve selected this but I get an error at the bottom of the chart.
Most columns in my table are strings with one that’s a number I wish to total, this is Col. 12, how can I show a total of these values?I guess I’m missing something obvious or the option isn’t what I think it is.
Regards,
Phil-
This topic was modified 5 years, 8 months ago by
-
This topic was modified 5 years, 8 months ago by
-
August 10, 2018 at 15:47 #21761
Alexander Bautz
KeymasterHi,
I’m not sure which error you get, but you must specify the first column in the chart as Data Type String and not as Number.Alexander
-
August 10, 2018 at 16:46 #21768Participant
Ok, the first column is set as a number (Id) so I can change that but which rows are totalled, can it be specified?
-
August 11, 2018 at 08:36 #21774Keymaster
Columns with data type Number is totaled.
Alexander
-
August 11, 2018 at 09:28 #21780Participant
OK, Makes sense I suppose, I’ll give it a try.
Thanks
-
August 13, 2018 at 14:12 #21803Participant
Alexander,
That worked.Sorry, I just realised I posted in the wrong forum, should have been in SPJS charts.
Is there any way to format the Totals row, I’ve looked a “inspect element” but cannot see how to sort it.
-
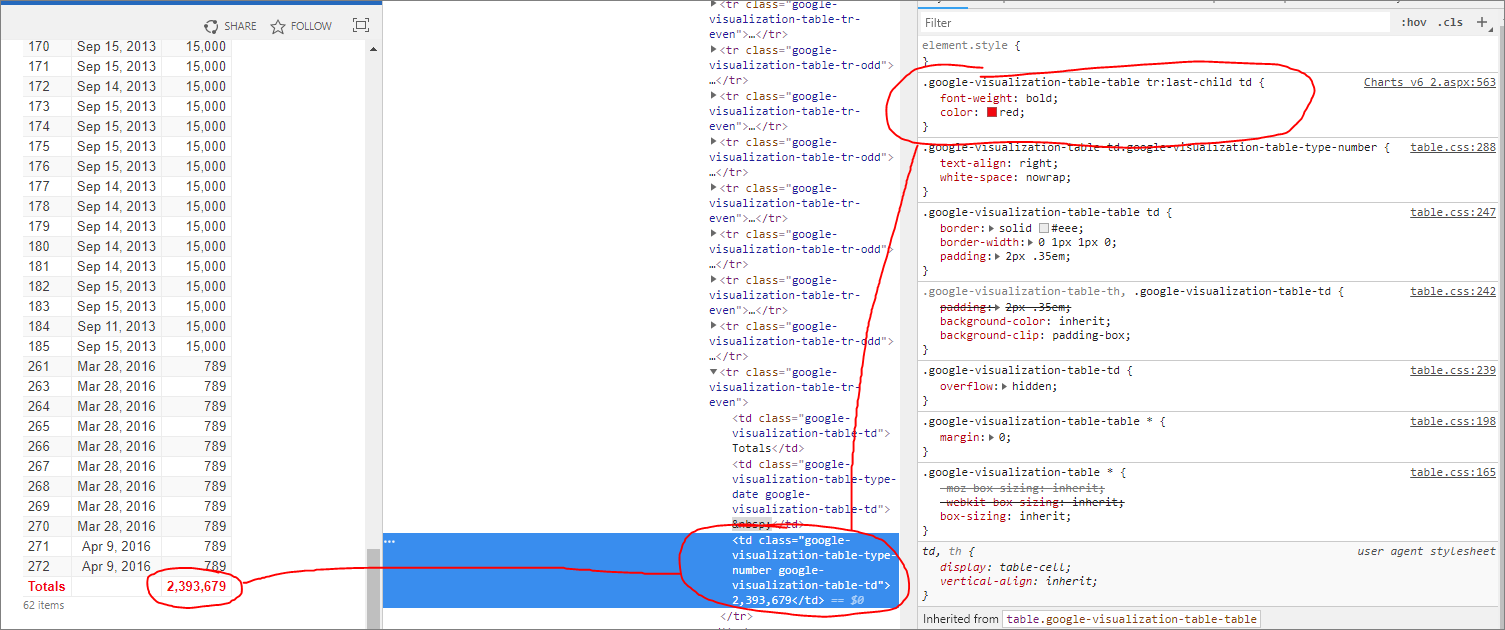
August 14, 2018 at 19:19 #21812Keymaster
You can format the totals row by adding a Script Editor Web Part to the page and add this CSS:
<style type="text/css">
.google-visualization-table-table tr:last-child td{
	font-weight:bold;
	color:red;
}
</style>
I moved the topic to the correct forum.
Alexander
-
-
August 14, 2018 at 19:36 #21818Participant
Brilliant, thanks for the help.
-
August 15, 2018 at 10:36 #21824Participant
Alexander,
Tried it this morning but doesn’t seem to work.
I added a CEWP webpart and pointed to a CSS file in the SPJS folder
The left alignment works so the file is being processed but the totals row isn’t affected at all.<style type="text/css"> .spjs_filterPlaceholderInner{ text-align:left!important; } .google-visualization-table-table tr:last-child td{ font-weight:bold; color:red; } </style>Cheers,
Phil-
This reply was modified 5 years, 8 months ago by
Phil Grant.
-
This reply was modified 5 years, 8 months ago by
-
This reply was modified 5 years, 8 months ago by
-
This reply was modified 5 years, 8 months ago by
-
August 15, 2018 at 15:30 #21830Keymaster
Try adding the !important flag like this:
.google-visualization-table-table tr:last-child td{
	font-weight:bold!important;
	color:red!important;
}
Alexander
-
August 15, 2018 at 16:07 #21832Participant
Sorry, still not working.
-
August 15, 2018 at 16:17 #21834Keymaster
Strange, try using the developer tools to inspect the table row like the attached image.
Alexander
Attachments:
-
August 15, 2018 at 16:24 #21837Participant
I just opened it in Chrome so I get a similar look to your and the CSS seems to have worked in Chrome …..ARGHHHH!
I suppose i’s something to do with IE and sharepoint 2010 again 🙁
-
August 15, 2018 at 17:03 #21839Keymaster
Ah – yes, I didn’t think of it but IE doesn’t support the last-child selector when in IE8-mode.
You can fix it with JavaScript, but it’s not as clean as with CSS. Look at this part of the user manual: https://spjsblog.com/spjs-charts-for-sharepoint/spjs-charts-for-sharepoint-user-manual/#Attaching_an_event_handler
Add the ready-event code (adapt it to your chart) and have it run this snippet when your chart is ready:
jQuery(".google-visualization-table-table tr:last td").css({
	"font-weight":"bold",
	"color":"red"
});
Alexander
-
August 15, 2018 at 17:05 #21841Participant
Thanks, we should be switching to SharePoint 2016 Enterprise later in the year, hopefully it will be easier to use!
-
August 16, 2018 at 12:22 #21847Participant
Alexander,
Just to let you know that your solution works great,Thanks,
Phil -
August 16, 2018 at 17:43 #21851Keymaster
Thanks for the feedback.
Alexander
-
-
AuthorPosts
- You must be logged in to reply to this topic.