› Forums › SPJS Charts for SharePoint › SPJS Chart v6 .0.1 BETA : Table Chart Bugs
- This topic has 14 replies, 2 voices, and was last updated 7 years, 2 months ago by
Alexander Bautz.
-
AuthorPosts
-
-
December 14, 2016 at 09:56 #14508
Jhap
ParticipantHi Sir Alexander
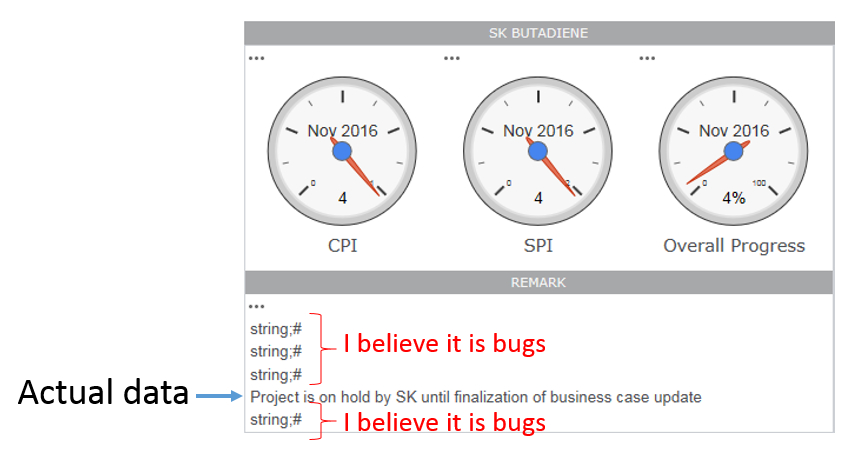
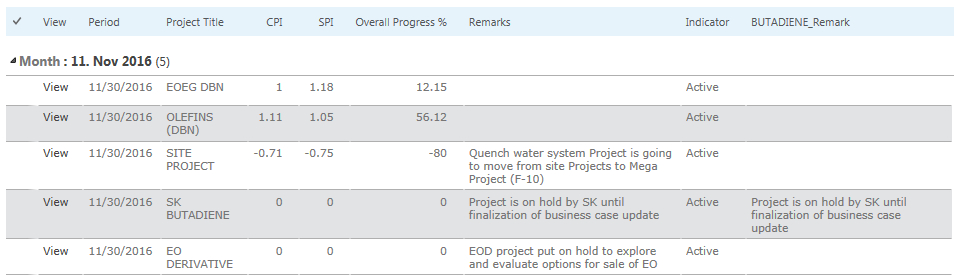
I have tested the SPJS Chart v6 .0.1 BETA 1 and in my scenario I have a calculated single line text column and once the data is rendered using Table chart it shows extra text string;#
Please refer on the attached image.
Thank you.
Attachments:
-
December 16, 2016 at 00:35 #14561
Alexander Bautz
KeymasterI’m not able to recreate this issue. Can you share a bit more details about how your datasource looks like, and how you have set up the chart?
Alexander
-
December 18, 2016 at 04:48 #14581Participant
Hi Sir Alexander
Here are the screenshot for your reference please.
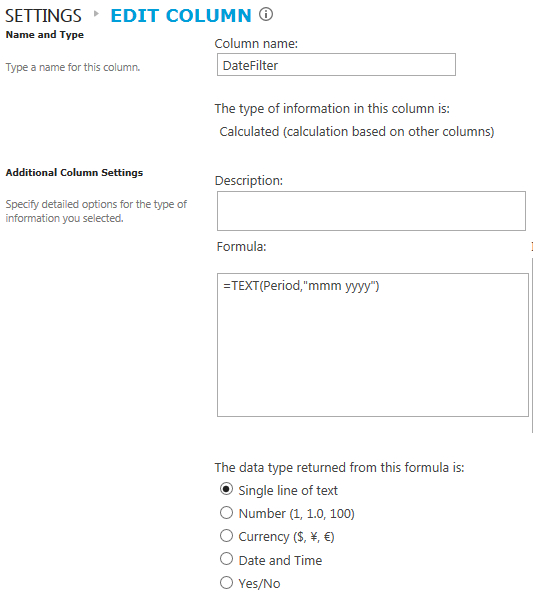
Column 1 :: Date
=TEXT(Period,”mmm yyyy”)Column 2 :: Remark
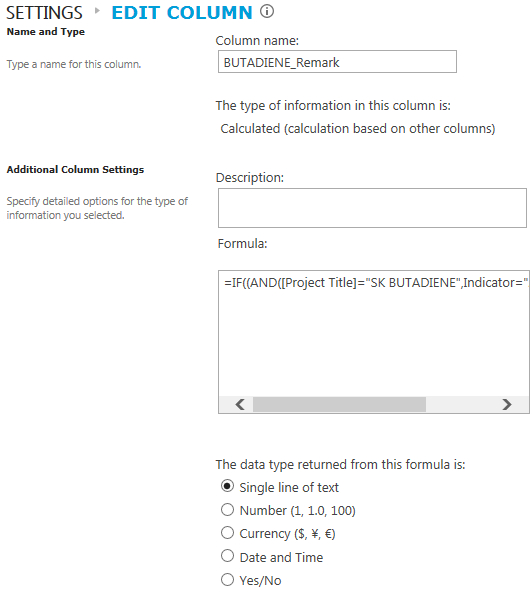
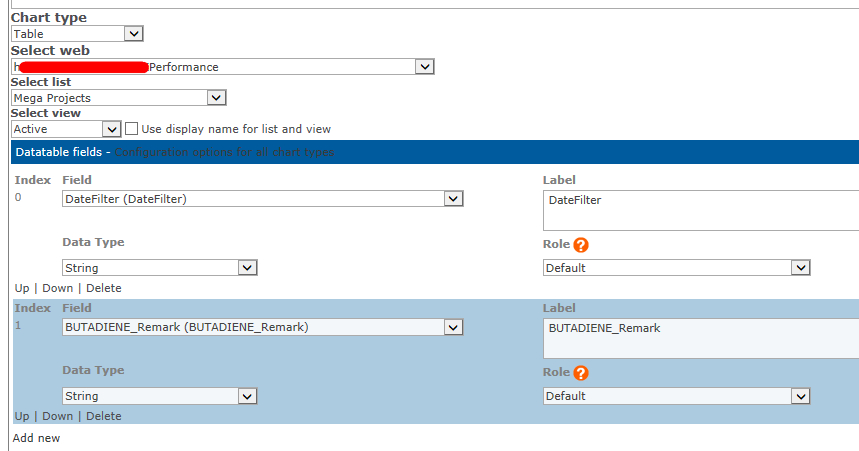
=IF((AND([Project Title]=”SK BUTADIENE”,Indicator=”Active”)),Remarks,””)Chart Type :: Table
Thank you.
-
December 28, 2016 at 19:44 #14679Keymaster
Sorry for the late reply. I cannot recreate this using calculated columns in a table chart. Could you possibly share a screenshot of the configuration for your table chart as well?
Alexander
-
December 29, 2016 at 11:46 #14687Participant
Hi Sir Alexander
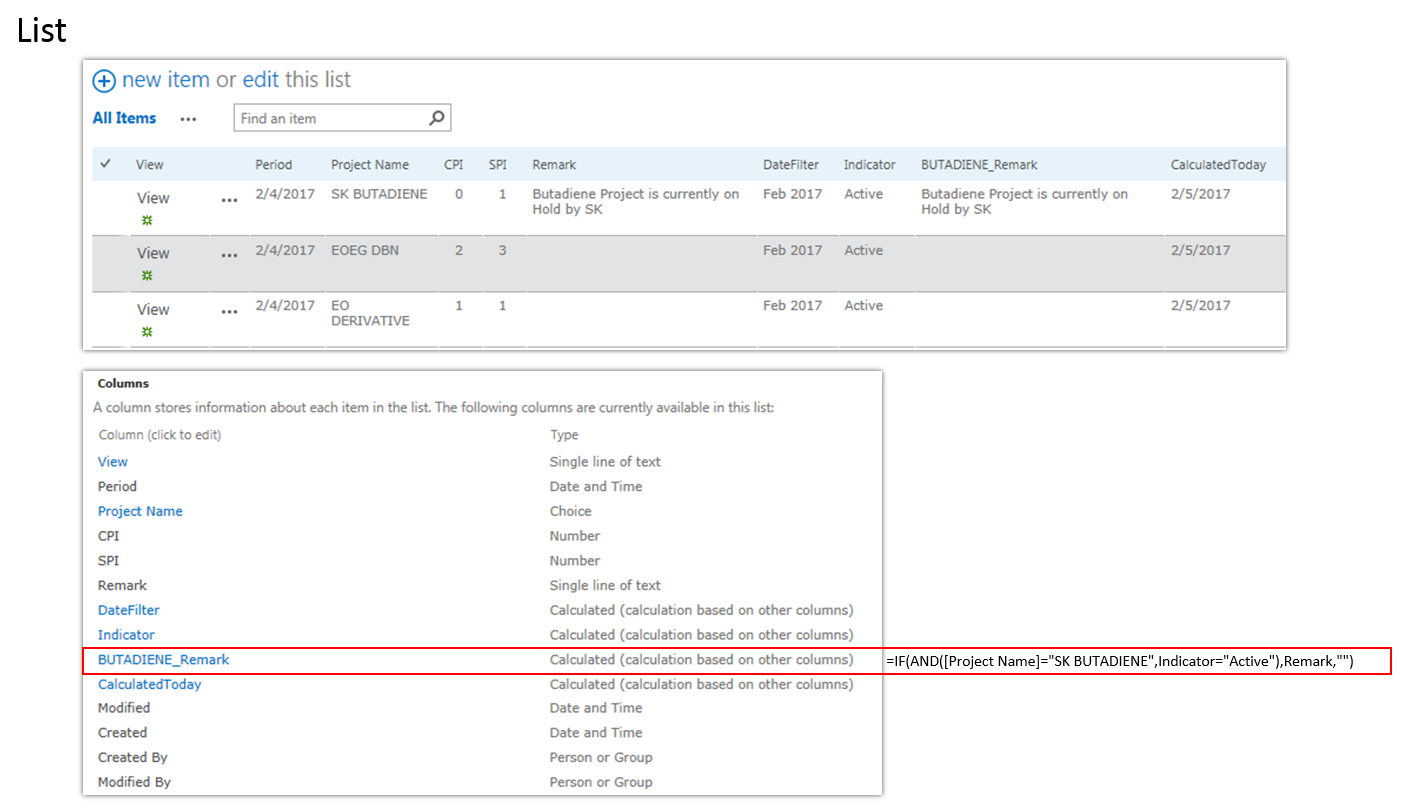
I have a list with this fields…
Field 1 : “Period” (the user enter the complete date)
Field 2 : “Project Title”
Field 3 :: “DateFilter” reading the “Period” field
=TEXT(Period,”mmm yyyy”)Field 4 : “Project” (the user selecting the name in the drop list)
Field 5 : “Remarks”
Field 5 :: “Butadien Remark”
=IF((AND([Project Title]=”SK BUTADIENE”,Indicator=”Active”)),[Remarks],””)=============================================================
My list has a filter and that will only show the ACTIVE items. The field “Butadien Remark” on the otherhand will only show data if it meet the condition.
As you can see in the screenshot it show the content, but the table chart also render the empty column and it shows “string;#”
PS: this is the same setting I have in SPJS Chart v5 and is working very fine.
=============================================================
My Table chart configuration as per the screenshot
Attachments:
-
December 29, 2016 at 21:32 #14694Keymaster
Thanks,
I was able to recreate it and will fix it in the next release.Best regards,
Alexander -
January 1, 2017 at 08:26 #14836Participant
Hi Sir Alexander
-
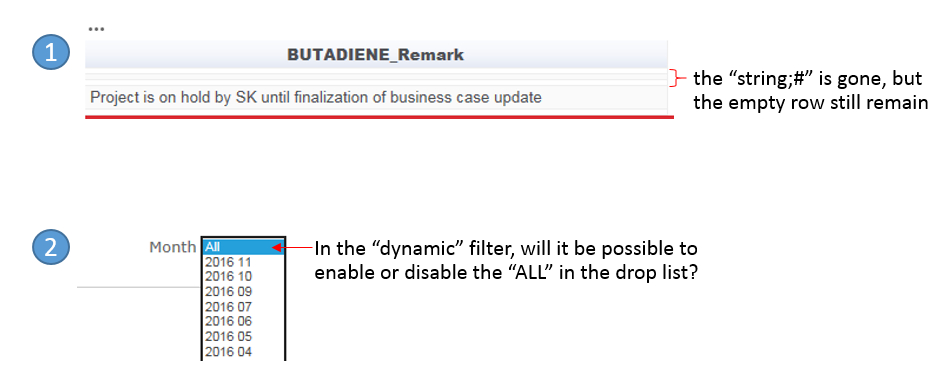
1. the “string;#” is gone, but the empty row still remain.
2. In the “dynamic” filter, will it be possible to enable or disable the “ALL” in the drop list and it will automatically default the very first option?
Please refer on the screenshot.
Thank you.
-
This reply was modified 7 years, 3 months ago by
Jhap.
Attachments:
-
This reply was modified 7 years, 3 months ago by
-
January 5, 2017 at 21:30 #14886Keymaster
1: Fixed in the upcoming release (if you use the “Remove items with no value in the first column” in the Options tab).
2: Yes, will be in the next release.
Alexander
-
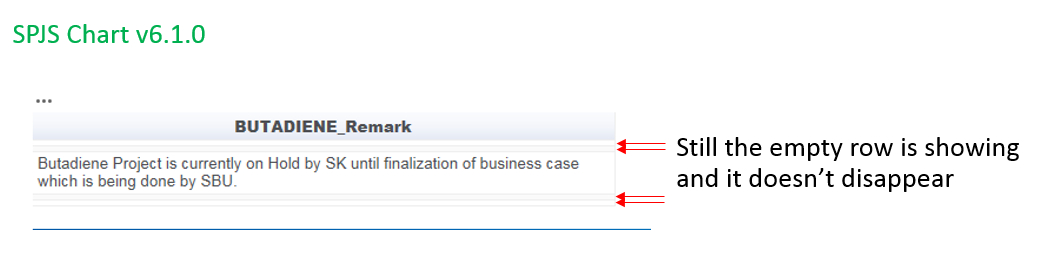
January 30, 2017 at 07:20 #15337Participant
Hi Sir Alexander,
Still the empty row is showing. Please the attached image.
THank you.
Attachments:
-
February 2, 2017 at 22:39 #15443Keymaster
I thought I had this fixed… Could you email me a few screenshots so I can see how the list you get the data from looks like, and how the chart config looks like, and I’ll try to recreate it and get it fixed.
Alexander
-
February 5, 2017 at 05:43 #15462Participant
Hi Sir Alexander,
Attached images described my list/column settings and the table chart configuration.
Thank you so much.
Attachments:
-
February 5, 2017 at 07:19 #15468Participant
Table_Chart_Config
Attachments:
-
February 10, 2017 at 17:56 #15545Keymaster
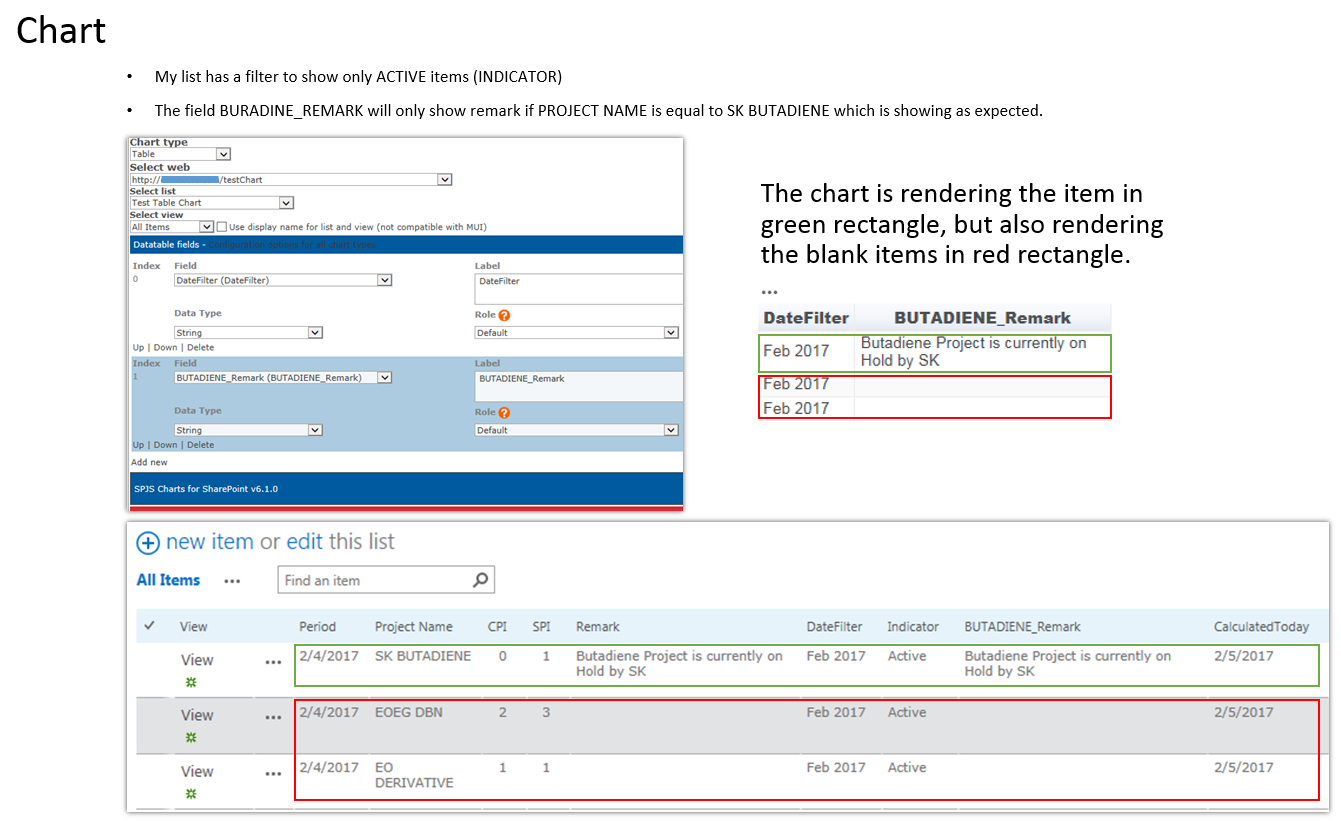
Sorry for the delay. I have looked at your screenshots and the setting “Remove items with no value in the first column” in the “Options” tab will not filter these rows away as this setting only applies to the first column.
There are however a much easier approach – just select a view you have already filtered on “PROJECT NAME = SK BUTADIENE” as the source for this chart.
Let me know how this works out.
Best regards,
Alexander -
February 12, 2017 at 11:34 #15560Participant
Hi Sir Alexandader,
Firstly, thank you so much for the great work.
I just follow your suggestion and I have created filtered view and used it though I have to create at least 5 views for each of the table chart, but not a big deal.
-
February 12, 2017 at 14:08 #15567Keymaster
You can also use the Custom CAML option so you don’t have to create all the views – click the “Get CAML from selected view” button to read the CAML form the selected view and use this as the starting point. Ask if you need help with the CAML.
Alexander
-
-
AuthorPosts
- You must be logged in to reply to this topic.