I have updated the “DashboardSelectorAndBuilder” example file with support for editing existing dashboards, using colspan and optionally restricting the “Add new” and “Edit” of dashboards.
Alexander
I have updated the “DashboardSelectorAndBuilder” example file with support for editing existing dashboards, using colspan and optionally restricting the “Add new” and “Edit” of dashboards.
Alexander
Please note: I had a typo in this list name of the list where the dashboards are stored. If you have already created this list with the wrong name, please rename the list (changing the display name is sufficient) from “SPJSChartDasboards” to “SPJSChartDashboards” and update the code.
I’ve updated the code example for the “DashboardSelectorAndBuilder.html” file to include support for changing the colspan, and to let you edit an existing dashboard. Please note that to enable edit I had to make one adjustment to the “OPTIONAL – Add a header as text or HTML here”. This means you must enter this header again the first time you edit a chart with this new version, but when you have saved it once you will be able to edit it again.
I have also added support for restricting the “Add new” and “Edit” to a SharePoint group. Add the group display name in the variable “restrictAddNewAndEditToThisGroup” in the top of the file “DashboardSelectorAndBuilder.html”.
In the previous article in this “series” I showed how you can create your own dashboards by manually writing the HTML code and store it in a custom list.
This proved to be a bit to complicated and I have now created a dashboard builder where you can specify a layout from one to four columns and as many rows as you like (please note that adding multiple charts to one page will make the page slower to load).
To use this tool, you must have the SPJS Charts solution already installed, and you must have set up the custom list as described in the previous article – linked in the top of this article.
Create a web part page and add the main SPJS Charts v6 loader web part to the page like described here. Then get the file “DashboardSelectorAndBuilder.zip” from here, and add it to a script editor web part (unzip first) in the same web part page.
Alternatively you can store this code (after you unzip it) in a document library and link to the file in a ContentEditorWebPart (CEWP).
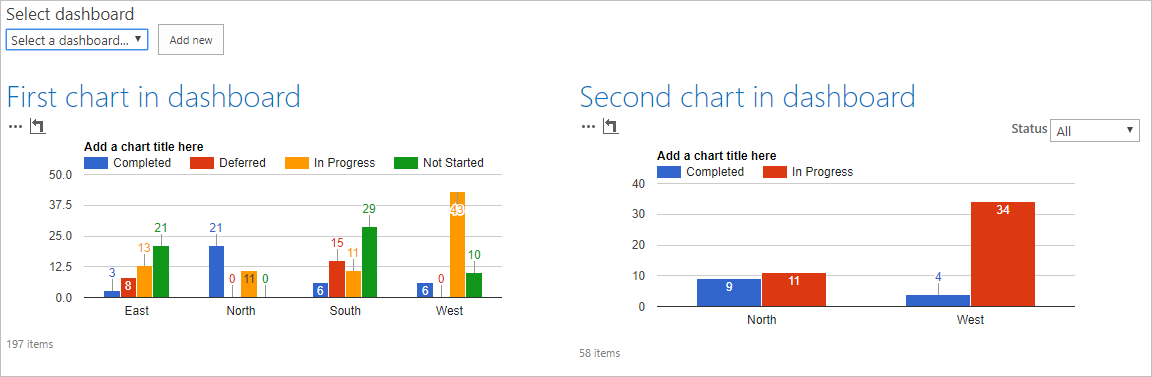
Your page should then look like this:
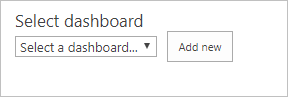
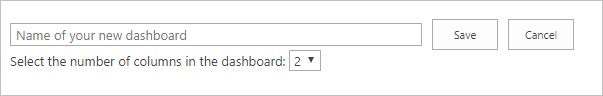
Click “Add new” to name your new dashboard and select the number of columns:
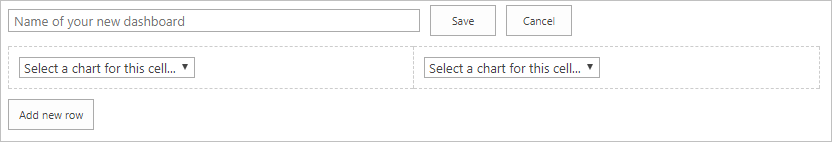
Then add the charts from the collection of charts you have already created in this site:
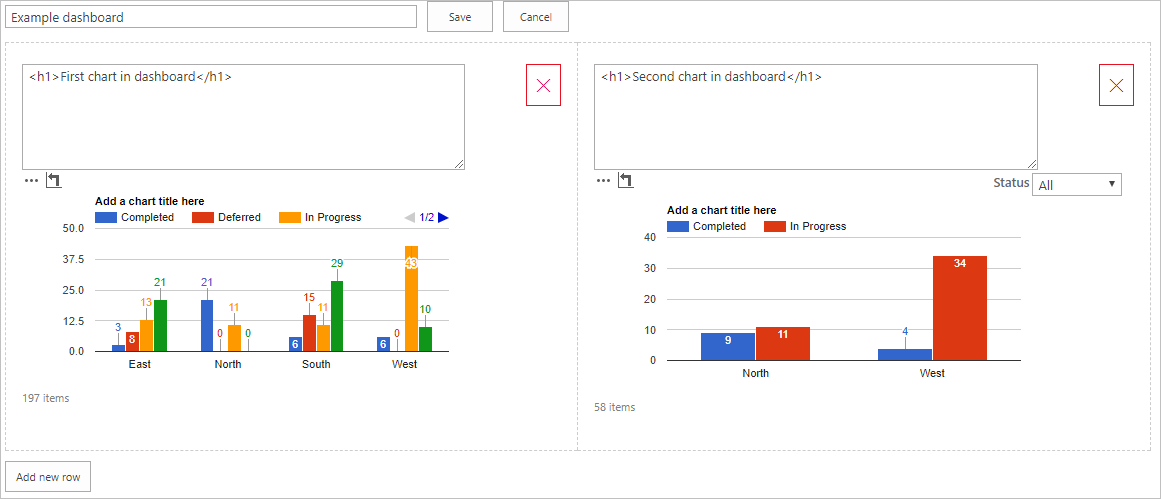
Build your dashboard by adding charts and optionally inserting a header text / HTML:
Hit “Save” and reload the page. Select your new dash from the dropdown:
Let me know in the comments or in the forum if you have any questions.
Alexander
An follow-up / enhancement on this article is found here. You should complete “Step one” in this article, and then go to the new article.
By request I have created an example code snippet that can read a list of pre-configured dashboards that are stored in a custom list.
I first thought about letting the user save a dashboards based on the charts selected from the dropdown select in the example file “loadAllChartsFromDropdown.html” that I added to the download package on August 22. I changed my mind and chose to let a super-user add this as HTML in a custom list. The reason for this is that you can put the charts in a table layout to have them side-by-side and possibly add some text / HTML in between the charts.
Create a web part page and add the main SPJS Charts v6 loader web part to the page like described here.
Then add a custom list named “SPJSChartDashboards” (this name is hard-coded in the example html file so don’t get creative and change the name).
Please note: I had a typo in this list name both here and in the code example. If you have already created this list with the wrong name, please rename the list (changing the display name is sufficient) from “SPJSChartDasboards” to “SPJSChartDashboards” and update the code.
Add one additional field named “HTML”. This field should be of type “Multiple lines of text – Plain text”.
Add your first example dashboard like this:
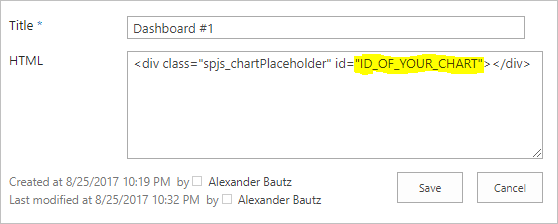
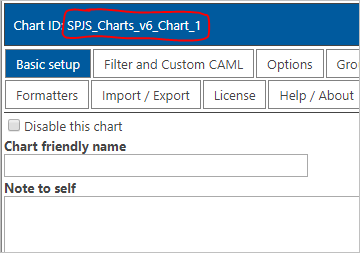
Add the ID of your chart where I have highlighted in yellow. You find this ID in the chart you have configured in another page in this site like this:
Add a script editor web part in the web part page you crated in step one with the code snippet from the file “DashBoardSelector” downloaded here.
Alternatively you can store this code(after you unzip it) in a document library and link to the file in a ContentEditorWebPart (CEWP).
Your page will look like this after you have added the script:
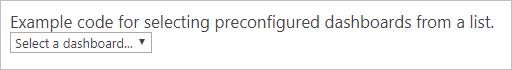
Select your dashboard, and watch the charts being drawn in the page.
If you like to have for example four charts in a table, use this format (normal HTML table):
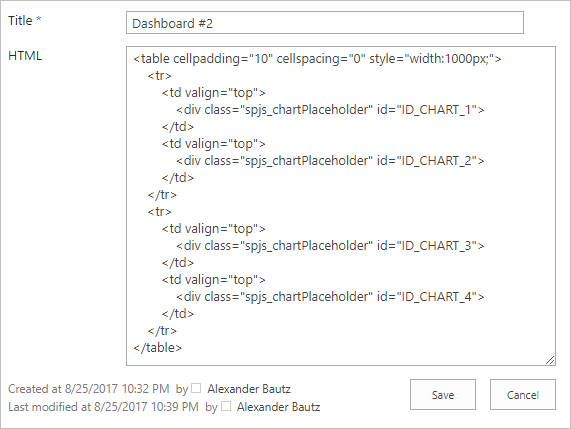
Here is the HTML – replace “ID_CHART_X” with your actual chart ID.
<table cellpadding="10" cellspacing="0" style="width:1000px;">
 <tr>
 <td valign="top">
 <div class="spjs_chartPlaceholder" id="ID_CHART_1">
 </td>
 <td valign="top">
 <div class="spjs_chartPlaceholder" id="ID_CHART_2">
 </td>
 </tr>
 <tr>
 <td valign="top">
 <div class="spjs_chartPlaceholder" id="ID_CHART_3">
 </td>
 <td valign="top">
 <div class="spjs_chartPlaceholder" id="ID_CHART_4">
 </td>
 </tr>
</table>
Let me know in the comments or in the forum if you have any questions.
Alexander
I have fixed a few bugs and added one new chart type. I have also added a new option to instead of loading the chart, render a button the user can click to show the chart. This may help on load time if you have many charts in one page.
Please post any questions in the forum.
Best regards,
Alexander
I have added an example code to use in a dashboard to let the user select from any chart created in the same site. You find it here.
Please read the “ReadMe.txt” file in the zip file.
Let me know if you have any questions.
Alexander
I have updated the SPJS Charts for SharePoint package with a few bugfixes related to using Google Maps and problems validating the Google Maps API key.
See complete change log here: https://spjsblog.com/spjs-charts-for-sharepoint/spjs-charts-for-sharepoint-change-log/
Best regards,
Alexander
I have released a new version with a few bugfixes – see change log here.
Alexander
I have released v6.1.3 of SPJS Charts for SharePoint. You find the change log here: https://spjsblog.com/spjs-charts-for-sharepoint/spjs-charts-for-sharepoint-change-log/
I have tried to address the problem with using SPJS Charts for SharePoint with IE on SharePoint 2010.
Please post any feedback in the forum: https://spjsblog.com/forums/forum/spjs-cfs/
Best regards,
Alexander